. 2013 Aug 6;8(8):e69989.
doi: 10.1371/journal.pone.0069989. Print 2013.

Conditional knockout of tumor overexpressed gene in mouse neurons affects RNA granule assembly, granule translation, LTP and short term habituation

Affiliations

Conditional knockout of tumor overexpressed gene in mouse neurons affects RNA granule assembly, granule translation, LTP and short term habituation

Elisa Barbarese et al. PLoS One. .

Abstract

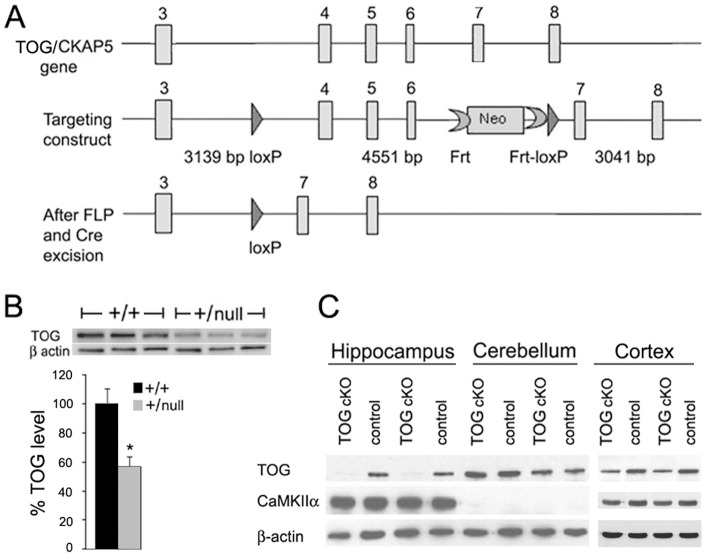
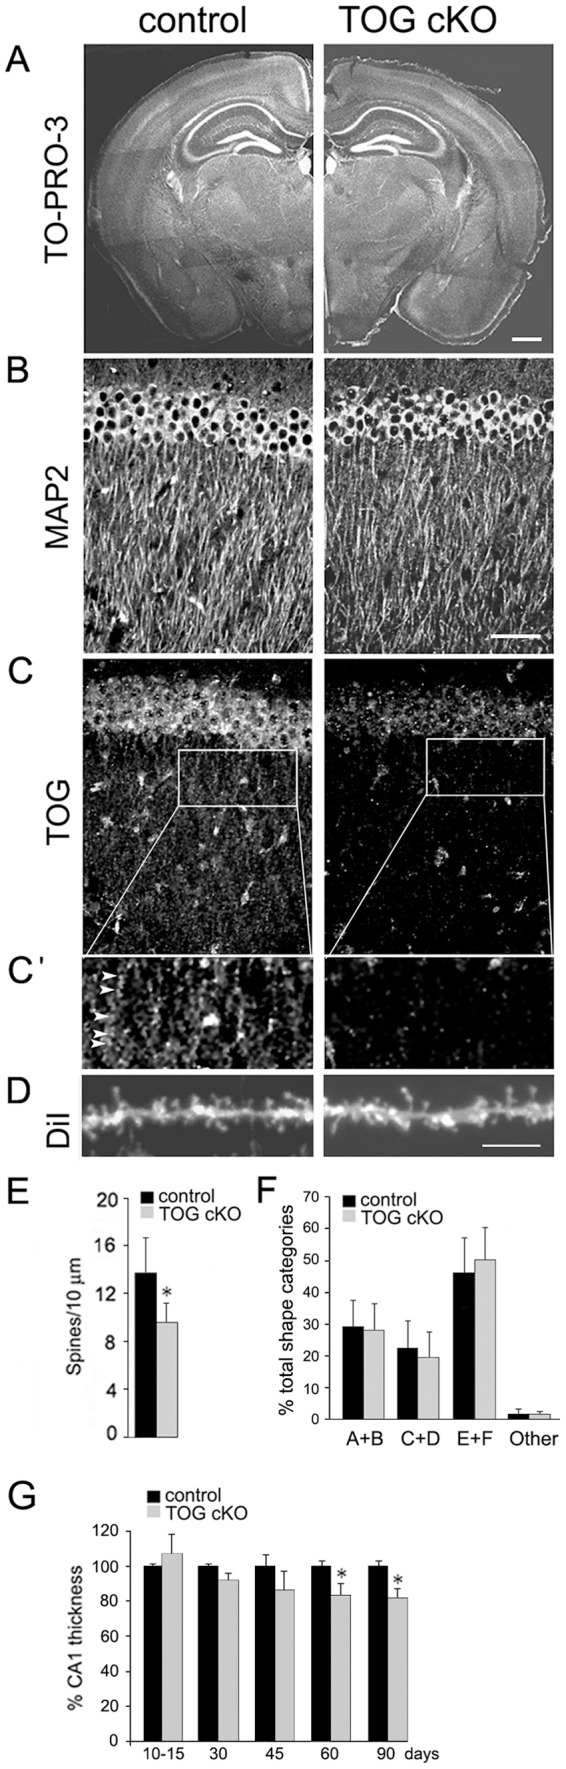
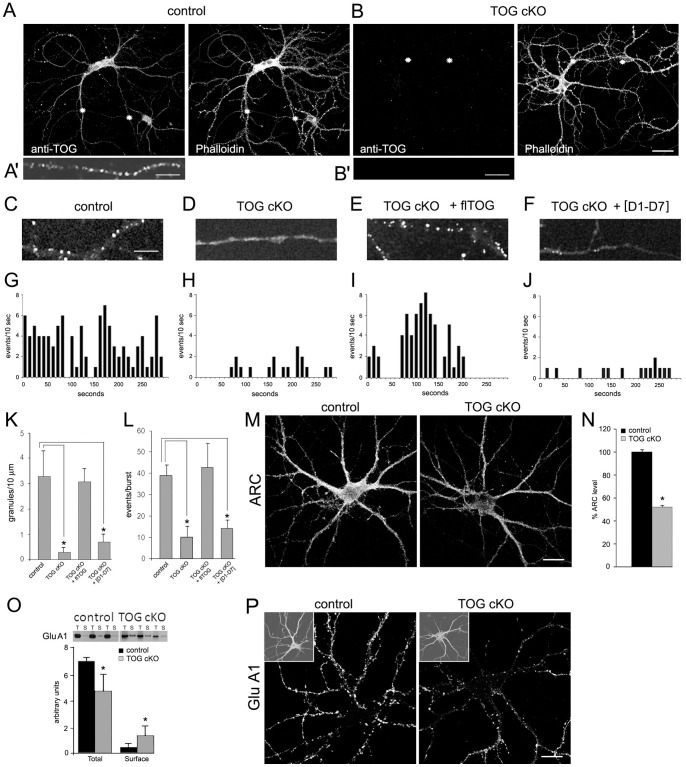
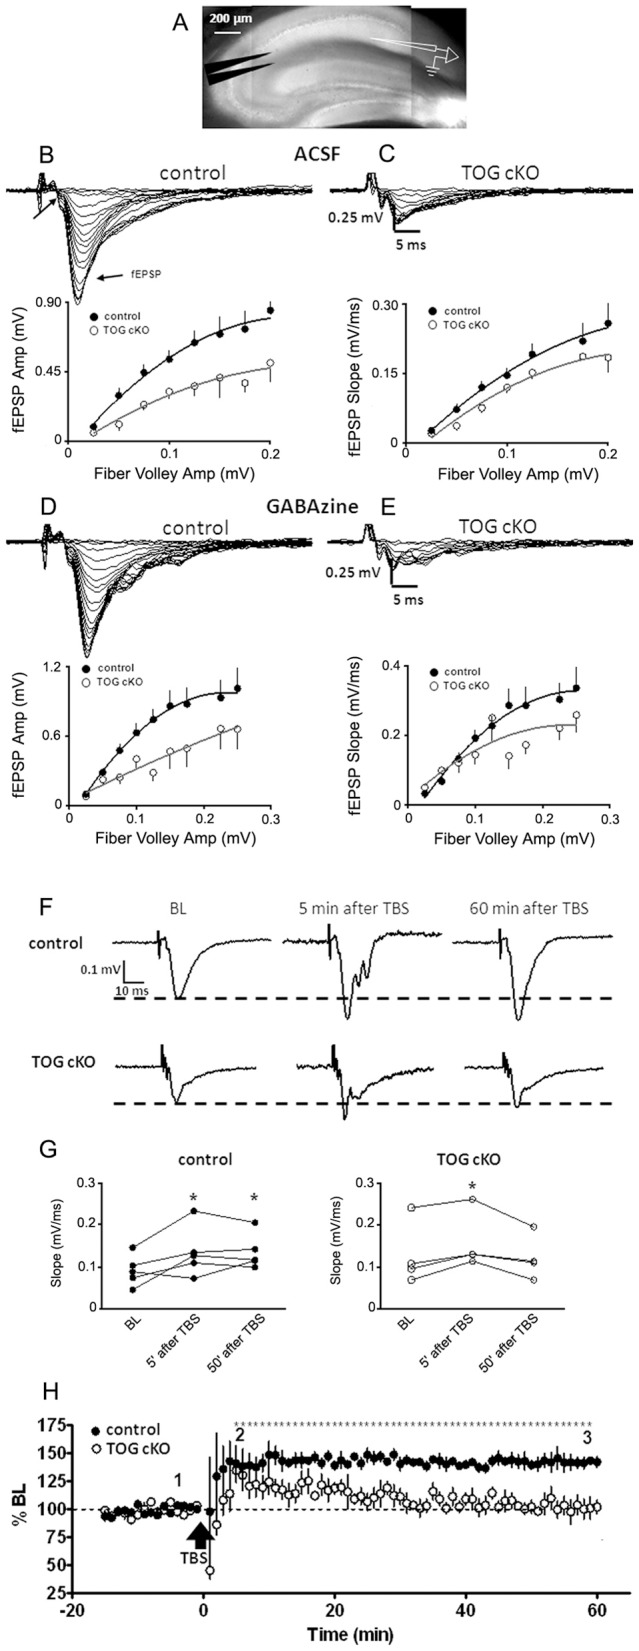
In neurons, specific RNAs are assembled into granules, which are translated in dendrites, however the functional consequences of granule assembly are not known. Tumor overexpressed gene (TOG) is a granule-associated protein containing multiple binding sites for heterogeneous nuclear ribonucleoprotein (hnRNP) A2, another granule component that recognizes cis-acting sequences called hnRNP A2 response elements (A2REs) present in several granule RNAs. Translation in granules is sporadic, which is believed to reflect monosomal translation, with occasional bursts, which are believed to reflect polysomal translation. In this study, TOG expression was conditionally knocked out (TOG cKO) in mouse hippocampal neurons using cre/lox technology. In TOG cKO cultured neurons granule assembly and bursty translation of activity-regulated cytoskeletal associated (ARC) mRNA, an A2RE RNA, are disrupted. In TOG cKO brain slices synaptic sensitivity and long term potentiation (LTP) are reduced. TOG cKO mice exhibit hyperactivity, perseveration and impaired short term habituation. These results suggest that in hippocampal neurons TOG is required for granule assembly, granule translation and synaptic plasticity, and affects behavior.


Conflict of interest statement

Competing Interests: The authors have declared that no competing interests exist.

Figures

Figure 1
Figure 1. TOG knockout in hippocampal neurons.
A. Diagram of the portion of the TOG/CKAP5 gene that is targeted for excision, and the targeting construct. The bottom panel shows the out-of-frame deletion after Cre excision. B. Western blot of brain homogenates from +/+ (control) and +/null mice stained with rabbit anti-TOG and mouse anti-β-actin; error bars indicate standard deviations; n = 6 animals for each genotype (t-test *p<0.05). C. Western blot of homogenates from hippocampus, cerebellum and cortex of 2 month old control (wild type) and TOG cKO mice stained with rabbit anti-TOG, mouse anti-αCaMKII and mouse anti-β-actin; n = 3 animals for each genotype.
Figure 2
Figure 2. Neuronal and dendritic spine morphology in control and TOG cKO hippocampus.
A. Coronal brain sections from 60 day control and TOG cKO mice stained with TO-PRO-3. The image montage for control and TOG cKO sections was assembled from multiple overlapping microscopic fields of the same tissue section. Scale bar  = 200 μm. B. Sections of hippocampal CA1 region from 60 day control and TOG cKO mice stained with anti-MAP 2. Scale bar  = 50 μm. C. Same sections as in B stained with anti-TOG. C'. Inset of the apical dendritic layer shows granules (arrowheads) in control but not in TOG cKO section. D. DiI labeled hippocampal CA1 dendrites in control and TOG cKO mice. Scale bar  = 2 μm. E. Quantification of the density of hippocampal CA1 apical spines in control and TOG cKO mice; n = 2 for each genotype. Twenty and 18 images were analyzed for control and TOG cKO, respectively. Error bars indicate standard deviations (t-test *p<0.01). F. Spine morphologies for control (909) and TOG cKO (696) spines classified according to . Types A and B are filopodia-like, types C and D are mushroom-like, types F and G are stubby. Error bars indicate standard deviations (t-test p>0.05). G. Quantification of thickness of hippocampal CA1 stratum pyramidale in control and TOG cKO mice. Brain cross-sections stained with TO-PRO-3 and anti-NeuN were imaged by fluorescence confocal microscopy; n = 2 to 3 mice for each genotype at each time point. Error bars indicate standard deviations (t-test, *p<0.05).
Figure 3
Figure 3. TOG expression, granule assembly, granule translation and ARC expression in control and TOG cKO hippocampal neurons in culture.
A. Fluorescence microscopic images of a cultured control neuron co-stained with anti-TOG and Alexa 488 conjugated secondary antibody and Texas-red conjugated phalloidin to label f-actin. A'. High magnification of the dendritic segment identified by 2 asterisks in A and stained with anti-TOG. Scale bar  = 10 μm. B. Fluorescence microscopic images of 2 cultured TOG cKO neurons co-stained with anti-TOG and Alexa 488 conjugated secondary antibody and Texas-red conjugated phalloidin. B'. High magnification of the dendritic segment identified by 2 asterisks in B and stained with anti-TOG. Scale bar  = 10 μm. C – F. Subcellular distribution of microinjected Venus-ARC RNA (labeled with Cy5-UTP) in control (C) and TOG cKO (D) hippocampal neurons and in TOG cKO neurons co-injected with full-length recombinant TOG protein (E) or with an equal molar mixture of individual TOG domains [D1–D7] (F). Injected cells were visualized by wide field fluorescence microscopy. Scale bar for C – F = 10 μm. G – J. Number of translation events per 10 sec is plotted versus time. Representative translation profiles under conditions described in C – F. K. Numbers of Venus-ARC RNA containing granules were counted in 10 μm dendritic segments of neurons treated as in C – F. Values represent average and standard deviations for numbers of granules per 10 μm dendritic segments (t-test, *p<0.05). L. Numbers of translation events per burst were counted for individual granules in control, TOG cKO, TOG cKO plus full length TOG protein and TOG cKO plus TOG domains in cells injected with Venus-ARC RNA (labeled with Cy5-UTP). A burst is defined as a sustained period of elevated translation activity (>3 events/10 sec) preceded and followed by periods of lower translation activity (<2 events/10 sec). Values represent average and standard deviations for numbers of events per burst in different granules (t-test, *p<0.05). M – N. ARC protein levels were measured in control and TOG cKO neurons (n = 8) after immunostaining with anti-ARC and a fluorescent secondary antibody. Error bars indicate standard deviations (t-test; *p<0.05). O. Quantification of total (T) and surface (S) GluA1 in control and TOG cKO hippocampal neurons in culture using biotinylation and western blotting. Error bars indicate standard deviations (t-test; *p<0.05). P. Control and TOG cKO hippocampal neurons were stained with anti-Glu A1 after 18 days in culture. The insets in P are low magnification of the same cells stained for actin. Scale bar in M and P = 20 μm.
Figure 4
Figure 4. fEPSPs and LTP in CA1 of control and TOG cKO hippocampal brain slices.
A. Infrared differential interference contrast micrograph of a hippocampal slice showing bipolar tungsten electrode (left) and glass recording electrode (right) placement. B – C. Electrical recording of field responses from control (B) and TOG cKO (C) slices at various stimuli intensities. Presynaptic fiber volley and field excitatory postsynaptic potential (fEPSP) are marked by arrows. Input output curves generated from control (n = 7 slices from 5 animals) and TOG cKO (n = 7 slices from 4 animals) plotted using fEPSP amplitudes (left) and rising slopes (right). Error bars represent standard deviation of the mean. D – E. Field responses and input output curves in the presence of GABAA antagonist (GABAzine, 5 μM) for the same specimens as in B and C. Error bars represent standard deviation of the mean. F. Electrical recording of field responses in control and TOG cKO hippocampal slices, in presence of GABAzine (5 μM), during baseline (BL) as well as 5 and 60 minutes after theta burst stimulation (TBS, 10 bursts in 2 sec). G. Rising slopes of fEPSPs during BL, and 5 and 60 minutes after TBS, from control (n = 5 animals) and TOG cKO (n = 4 animals). * denotes significant difference from BL (repeated measures ANOVA followed by Newman-Keuls multiple comparison test, p<0.05). H. Group time-course before and after TBS, normalized to the rising slopes of its corresponding BL. Error bars represent standard deviation of the mean.* denotes significant difference from BL period in control (repeated measures ANOVA followed by Bonferroni's multiple comparison test, p<0.05).
Figure 5
Figure 5. Behavioral phenotype of control and TOG cKO mice.
A – B. Marble burying test. A. Marble distribution 30 minutes after a control (left) or a TOG cKO (right) mouse was placed in the cage at position indicated by X. B. Average numbers of marbles buried for both control and TOG cKO mice (n = 10/genotype). Error bars indicate standard deviations (t-test; *p≤0.01). C. Passive avoidance test. Average latency to cross from the light chamber into the dark chamber for the training trial (Training) and retention trial (24 h) conducted 24 h after the training trial (n = 10 mice/genotype). Error bars indicate standard deviations (t-test; p>0.05). D – F. Open field test. D. Representative ambulation patterns of control and TOG cKO mice. E. Average numbers of beam breaks per minute recorded at 5 minutes intervals are shown for 10 control and 7 TOG cKO males. Standard deviations for control and TOG cKO mice are indicated in opposite directions for clarity. F. Ambulation decrement: differences in ambulation scores in (E) between the first 15 minutes and the last 15 minutes of the observation period calculated as percentage of the first 15 minutes of observation; (t-test; *p≤0.05). G – K. USV recording for control and TOG cKO animals. Representative USVs patterns for control (G) and TOG cKO (J) mice. H. Average numbers of USVs recorded per 5 sec at 5 sec intervals are shown for control (n = 5) and TOG cKO (n = 5) males (ANOVA, F = 11.7; df = 1,110; p = 0.009). Standard deviations for control and TOG cKO mice are indicated in opposite directions for clarity. I. USV frequencies for control and TOG cKO mice. Percent of USVs below 72 KHz, spanning the 72 KHz arbitrary boundary, and above 72 KHz during 1 min of recording. K. USVs categories for control and TOG cKO mice.

Similar articles

Cited by

References

    1. Al-Bassam J, Larsen NA, Hyman AA, Harrison SC (2007) Crystal structure of a TOG domain: Conserved features of XMAP215/Dis1-family TOG domains and implications for tubulin binding. Structure 15: 355–362. - PubMed
    1. Al-Bassam J, Chang F (2011) Regulation of microtubule dynamics by TOG-domain proteins XMAP215/Dis1 and CLASP. Trends Cell Biol 21: 604–614. - PMC - PubMed
    1. Gard DL, Kirschner MW (1987) A microtubule-associated protein from xenopus eggs that specifically promotes assembly at the plus-end. J Cell Biol 105: 2203–2215. - PMC - PubMed
    1. Widlund PO, Stear JH, Pozniakovsky A, Zanic M, Reber S, et al. (2011) XMAP215 polymerase activity is built by combining multiple tubulin-binding TOG domains and a basic lattice-binding region. Proc Natl Acad Sci U S A 108: 2741–2746. - PMC - PubMed
    1. Charrasse S, Schroeder M, Gauthier-Rouviere C, Ango F, Cassimeris L, et al. (1998) The TOGp protein is a new human microtubule-associated protein homologous to the xenopus XMAP215. J Cell Sci 111 (Pt 10): 1371–1383. - PubMed

Publication types

MeSH terms