

A network integration approach to predict conserved regulators related to pathogenicity of influenza and SARS-CoV respiratory viruses
- PMID: 23935999
- PMCID: PMC3723910
- DOI: 10.1371/journal.pone.0069374
A network integration approach to predict conserved regulators related to pathogenicity of influenza and SARS-CoV respiratory viruses
Abstract
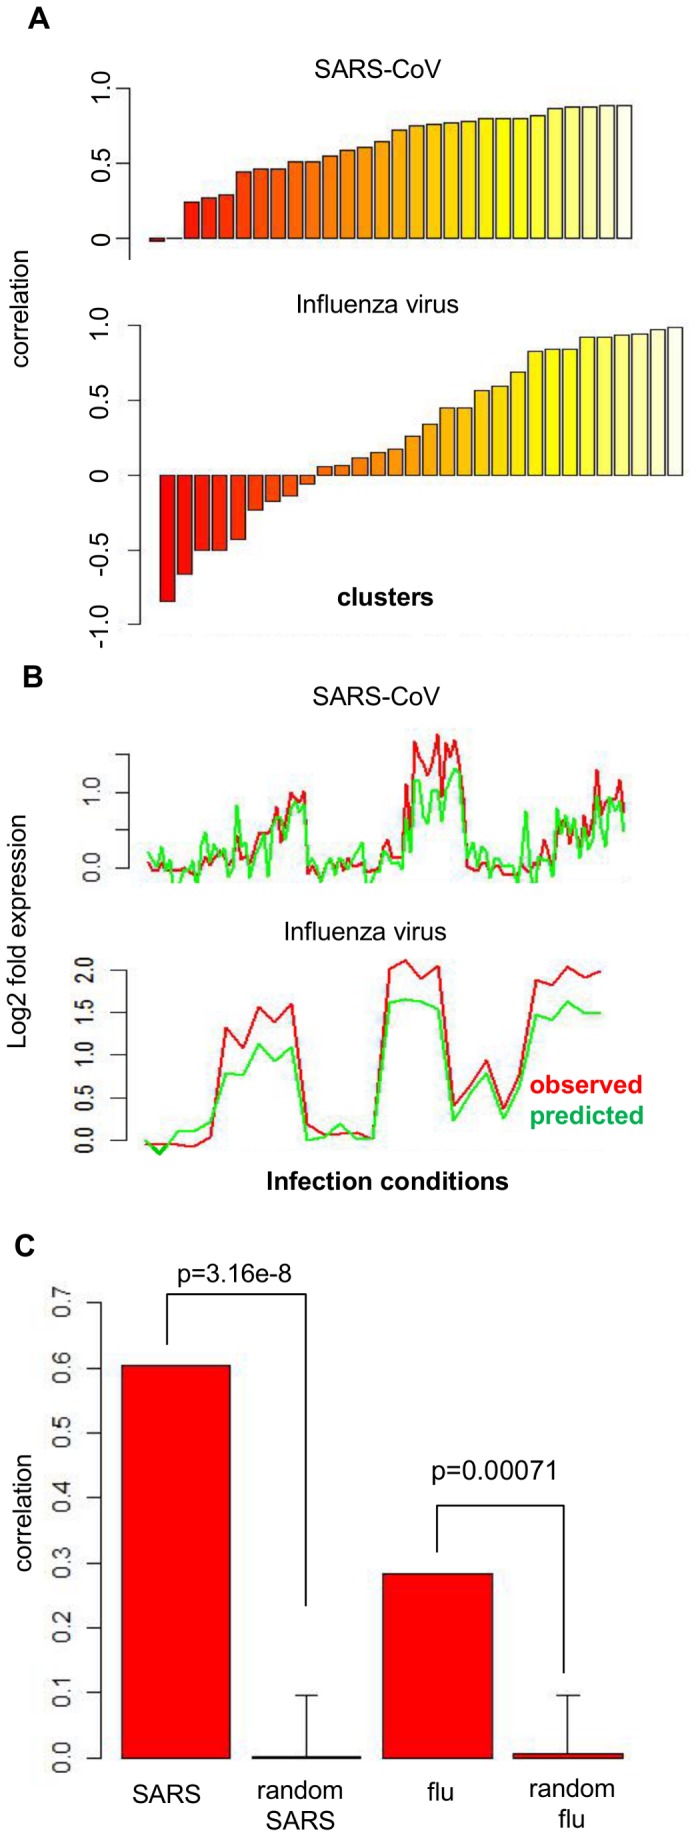
Respiratory infections stemming from influenza viruses and the Severe Acute Respiratory Syndrome corona virus (SARS-CoV) represent a serious public health threat as emerging pandemics. Despite efforts to identify the critical interactions of these viruses with host machinery, the key regulatory events that lead to disease pathology remain poorly targeted with therapeutics. Here we implement an integrated network interrogation approach, in which proteome and transcriptome datasets from infection of both viruses in human lung epithelial cells are utilized to predict regulatory genes involved in the host response. We take advantage of a novel "crowd-based" approach to identify and combine ranking metrics that isolate genes/proteins likely related to the pathogenicity of SARS-CoV and influenza virus. Subsequently, a multivariate regression model is used to compare predicted lung epithelial regulatory influences with data derived from other respiratory virus infection models. We predicted a small set of regulatory factors with conserved behavior for consideration as important components of viral pathogenesis that might also serve as therapeutic targets for intervention. Our results demonstrate the utility of integrating diverse 'omic datasets to predict and prioritize regulatory features conserved across multiple pathogen infection models.
Conflict of interest statement
Figures


Similar articles
-
Elevated temperature inhibits SARS-CoV-2 replication in respiratory epithelium independently of IFN-mediated innate immune defenses.PLoS Biol. 2021 Dec 21;19(12):e3001065. doi: 10.1371/journal.pbio.3001065. eCollection 2021 Dec. PLoS Biol. 2021. PMID: 34932557 Free PMC article.
-
Mechanisms of severe acute respiratory syndrome coronavirus-induced acute lung injury.mBio. 2013 Aug 6;4(4):e00271-13. doi: 10.1128/mBio.00271-13. mBio. 2013. PMID: 23919993 Free PMC article.
-
Complement Activation Contributes to Severe Acute Respiratory Syndrome Coronavirus Pathogenesis.mBio. 2018 Oct 9;9(5):e01753-18. doi: 10.1128/mBio.01753-18. mBio. 2018. PMID: 30301856 Free PMC article.
-
SARS-CoV replication and pathogenesis in an in vitro model of the human conducting airway epithelium.Virus Res. 2008 Apr;133(1):33-44. doi: 10.1016/j.virusres.2007.03.013. Epub 2007 Apr 23. Virus Res. 2008. PMID: 17451829 Free PMC article. Review.
-
Seasonality of Respiratory Viral Infections.Annu Rev Virol. 2020 Sep 29;7(1):83-101. doi: 10.1146/annurev-virology-012420-022445. Epub 2020 Mar 20. Annu Rev Virol. 2020. PMID: 32196426 Review.
Cited by
-
Metabolite, Protein, and Lipid Extraction (MPLEx): A Method that Simultaneously Inactivates Middle East Respiratory Syndrome Coronavirus and Allows Analysis of Multiple Host Cell Components Following Infection.Methods Mol Biol. 2020;2099:173-194. doi: 10.1007/978-1-0716-0211-9_14. Methods Mol Biol. 2020. PMID: 31883096 Free PMC article.
-
Network perturbation analysis of gene transcriptional profiles reveals protein targets and mechanism of action of drugs and influenza A viral infection.Nucleic Acids Res. 2018 Apr 6;46(6):e34. doi: 10.1093/nar/gkx1314. Nucleic Acids Res. 2018. PMID: 29325153 Free PMC article.
-
Toll-Like Receptor 3 Signaling via TRIF Contributes to a Protective Innate Immune Response to Severe Acute Respiratory Syndrome Coronavirus Infection.mBio. 2015 May 26;6(3):e00638-15. doi: 10.1128/mBio.00638-15. mBio. 2015. PMID: 26015500 Free PMC article.
-
Transcriptional landscape of SARS-CoV-2 infection dismantles pathogenic pathways activated by the virus, proposes unique sex-specific differences and predicts tailored therapeutic strategies.Autoimmun Rev. 2020 Jul;19(7):102571. doi: 10.1016/j.autrev.2020.102571. Epub 2020 May 3. Autoimmun Rev. 2020. PMID: 32376402 Free PMC article. Review.
-
Gene Expression Meta-Analysis Reveals Interferon-Induced Genes Associated With SARS Infection in Lungs.Front Immunol. 2021 Jul 23;12:694355. doi: 10.3389/fimmu.2021.694355. eCollection 2021. Front Immunol. 2021. PMID: 34367154 Free PMC article.
References
-
- McDermott JE, Taylor RC, Yoon H, Heffron F (2009) Bottlenecks and hubs in inferred networks are important for virulence in Salmonella typhimurium. J Comput Biol 16: 169–180. - PubMed
Publication types
MeSH terms
Associated data
- Actions
- Actions
- Actions
Grants and funding
LinkOut - more resources
Full Text Sources
Other Literature Sources
Molecular Biology Databases
Miscellaneous
