. 2013;9(7):e1003493.
doi: 10.1371/journal.ppat.1003493. Epub 2013 Jul 25.

The viral chemokine MCK-2 of murine cytomegalovirus promotes infection as part of a gH/gL/MCK-2 complex

Affiliations

The viral chemokine MCK-2 of murine cytomegalovirus promotes infection as part of a gH/gL/MCK-2 complex

Felicia M Wagner et al. PLoS Pathog. 2013.

Abstract

Human cytomegalovirus (HCMV) forms two gH/gL glycoprotein complexes, gH/gL/gO and gH/gL/pUL(128,130,131A), which determine the tropism, the entry pathways and the mode of spread of the virus. For murine cytomegalovirus (MCMV), which serves as a model for HCMV, a gH/gL/gO complex functionally homologous to the HCMV gH/gL/gO complex has been described. Knock-out of MCMV gO does impair, but not abolish, virus spread indicating that also MCMV might form an alternative gH/gL complex. Here, we show that the MCMV CC chemokine MCK-2 forms a complex with the glycoprotein gH, a complex which is incorporated into the virion. We could additionally show that mutants lacking both, gO and MCK-2 are not able to produce infectious virus. Trans-complementation of these double mutants with either gO or MCK-2 showed that both proteins can promote infection of host cells, although through different entry pathways. MCK-2 has been extensively studied in vivo by others. It has been shown to be involved in attracting cells for virus dissemination and in regulating antiviral host responses. We now show that MCK-2, by forming a complex with gH, strongly promotes infection of macrophages in vitro and in vivo. Thus, MCK-2 may play a dual role in MCMV infection, as a chemokine regulating the host response and attracting specific target cells and as part of a glycoprotein complex promoting entry into cells crucial for virus dissemination.


Conflict of interest statement

The authors have declared that no competing interests exist.

Figures
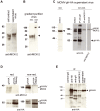
Figure 1
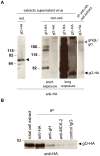
Figure 1. MCK-2 is a virion protein forming a high-molecular weight complex co-migrating with gH.
(A–E) Lysates of cells, supernatant virus, or precipitated proteins were separated on SDS-polyacrylamide gels and analyzed by Western blot using the anti-MCK-2 antibody 5A5 to detect MCK-2 or the anti-HA antibody 3F10 to detect gH-HA. The positions of the molecular weight markers (kDa) are indicated. (A) Infected cells and supernatant virus from NIH3T3 cells infected with wildtype MCMV were harvested 5 days after infection and lysed in reducing sample buffer. (B) Gradient purified wildtype MCMV was lysed in reducing (red.) and non-red. sample buffer. The MCK-2 specific bands are indicated by arrows. (C) Supernatant virus from NIH3T3 cells infected with MCMV-gH-HA was either directly lysed in red. or non-red. sample buffer (extract) or proteins were precipitated from lysates with anti-gH or anti-MCK2 antibodies and then analyzed under non-red. conditions. Monomeric gH-HA (black arrow) and gH/gL/MCK-2 (white arrow) are indicated by arrows. (D) Supernatant virus from NIH3T3 cells infected with MCMV-gH-HA or MCMV-gH-HA/129stop was lysed in red. or non-red. sample buffer. The upper panel shows extracts prepared under red. and non-red. conditions and stained with an anti-MCK-2 antibody. The lower panel shows the same extracts stained with an anti-HA antibody to detect gH-HA. The gH/MCK-2 band formed under non-red. conditions is indicated by an arrow. The MCMV-gH-HA/129stop extracts showed an at least fivefold higher protein content. (E) NIH3T3 cells were infected with MCMV-gH-HA and supernatant virus harvested 5 days after infection. Lysates of supernatant virus were either directly analyzed for gH-HA expression (supernatant virus) or after immunoprecipitation using a mouse IgG control antibody, an anti-HA antibody, an anti-gH antibody, or an anti-MCK2 (2H9) antibody recognizing the m131 region of MCK-2. The gH-HA specific protein band is indicated.
Figure 2
Figure 2. MCK-2 associates with gH in a complex distinct from gH/gL/gO.
(A) Supernatant virus from NIH3T3 cells infected with MCMV-gH-HA or MCMV-gO-HA was lysed in red. or non-red. sample buffer. gO-HA and gH-HA were detected with an anti-HA antibody. Monomeric gO-HA (black arrow) and gH/gL/gO (white arrow) are indicated by arrows. Two exposures of the Western blots showing non-red. extracts are depicted. As a control, gO-HA was precipitated from a lysate of MCMV-gO-HA infected cells with an anti-HA antibody and analyzed under non-red. conditions. (B) MEF were infected with MCMV-gO-HA, and three days after infection, cells were harvested and either directly analyzed for gO-HA expression (total cell extract) or after immunoprecipitation using an anti-HA antibody, an anti-gH antibody, an anti-MCK2 (2H9), or a mouse IgG control antibody. (A–B) The gO-HA specific protein band runs at about 70 kDa. The positions of the molecular weight markers (kDa) are indicated.
Figure 3
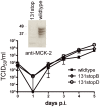
Figure 3. Multistep growth curves in NIH3T3 cells infected with wildtype MCMV and 131stopB and 131stopD mutants.
Cells were infected at an m.o.i. of 0.1, supernatants were harvested every 24 hours and titrated. Shown are means +/− SD of three independent growth curves for each virus. The insert depicts the loss of MCK-2 by staining extracts of NIH3T3 cells infected with wildtype or 131stopB virus with an anti-MCK-2 (5A5) antibody. p.i., post infection.
Figure 4
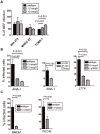
Figure 4. Expression of full-length MCK-2 facilitates the infection of macrophages in vitro.
(A) MEF, NIH3T3, MHEC-5T and TCMK-1 cells were plated in 96 well plates, infected with wildtype MCMV and 131stop mutants of MCMV at an m.o.i. of 0.5, and 6 h after infection stained for MCMV immediate early 1 (IE1) protein by indirect immunofluorescence. Each infection was done in triplicates and for each well IE1+ cells were counted and the means of these counts related to the mean of IE1+ MEF. The value for MEF was set to 100%. Shown are means +/− SEM of at least 4 independent experiments. Infection of TCMK-1 with m131stop mutants was significantly enhanced compared to wildtype infection. The P values (Student's t-test) are indicated in the histograms. (B) Immortalized macrophages ANA-1 (left and middle panel) and J774 (right panel) were infected in suspension with wildtype MCMV or MCMV-gH-HA carrying a wildtype MCK-2 or with the MCK-2 mutants m131stopB or D, MCMV-gH-HA/129stop, or pSM3fr BAC-derived virus. The numbers of infected macrophages were determined by intracellular FACS staining for IE1+ cells. All infections with MCK-2 mutants showed significantly lower numbers of infected macrophages than infections with wildtype virus. The P values (Student's t-test) are indicated in the histograms. Shown are means +/−SEM of 3 to 4 independent experiments. (C) Primary BMDM (left panel) and cells in the macrophage-enriched gate of PEC (PEC/M) (right panel) were infected with wildtype virus or the MCK-2 mutant 131stopD as described under (B). The numbers of infected cells were significantly lower for the 131stop mutant. The P values (Student's t-test) are indicated in the histograms. Shown are means +/−SEM of 3 independent experiments. (B and C) All virus preparations have been titrated on MEF and for each experiment MEF were infected in parallel to confirm that wildtype and mutant viruses infected comparable percentages of MEF.
Figure 5
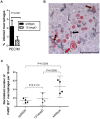
Figure 5. Expression of full-length MCK-2 facilitates the infection of macrophages in vivo.
(A) BALB/C mice were i.p. infected with 5×10⁵ PFU of wildtype or 131stopD MCMV. Six hours after infection PEC were harvested and CD11b+ F4/80+ macrophages analyzed for MCMV m06 expression by FACS analysis. The number of infected cells was significantly lower for the 131stop mutant. Shown are means +/−SD. Data were compiled from two independent experiments with altogether 9 mice analyzed per group. (B, C) Quantitation of infected F4/80+IE1+ liver-resident and recruited macrophages in situ. Two-color IHC analysis was performed on liver tissue sections derived from immunocompromised BALB/c mice on day 10 after intraplantar infection with viruses vpSM3fr, 131stopD, and wildtype virus. (B) Representative image of wildtype virus-infected liver tissue with red staining of the intranuclear viral protein IE1 for detecting infected cells and black staining of the marker antigen F4/80 (Ly71) for detecting macrophages. The red arrow exemplarily points to an enlarged hepatocyte nucleus containing the CMV-typical inclusion body that indicates productive infection. The black arrow exemplarily points to an uninfected F4/80+IE1 macrophage. Black-and-red striped arrows highlight cases of infected F4/80+IE1+ macrophages. The bar marker represents 50 µm. (C) Quantitation of infected F4/80+IE1+ liver macrophages and statistical analysis. Symbols represent individual mice infected with the indicated viruses. Data represent numbers of F4/80+IE1+ macrophages counted per 10-mm2 areas of liver tissue sections and normalized to the total numbers of infected IE1+ cells and F4/80+ macrophages present in the same sections to take account of differences in the levels of overall infection and macrophage recruitment. Mean values and SDs are indicated. (A–C) P values were calculated by unpaired, two-tailed Student's t test with Welch's correction not assuming equal variance. Differences are considered significant for P<0.05.
Figure 6
Figure 6. The patterns of gO- and MCK-2-dependent virus spread differ.
NIH3T3, NIH3T3-MCK2, and NIH3T3-gO cells were infected at an m.o.i. of 0.1 with the double mutant Δm74/131stop reconstituted in NIH3T3-gO cells (A-C). (A) Spread in culture was followed by staining cells for IE1 expression 3 and 6 days after infection. (B) Infection was enhanced by a centrifugation step at 2,000× g for 30 min at RT. Cells were stained for IE1 24 h after infection to show the comparable initial infection of NIH3T3, NIH3T3-gO, and NIH3T3-MCK-2 cells (left panel). Release of infectious virus was monitored in multistep growth curves (right panel). (C) The release of DNAse-protected viral DNA was followed by real-time PCR using supernatants from the growth curves under (B, right panel) plus an additional time point at 6 h post infection. The column labeled “in” shows the amount of DNAse-protected viral DNA in the Δm74/131stop inoculum used to infect the cells. (A–C) p.i., post infection.
Figure 7
Figure 7. MCK-2 dependent infection of MEF.
(A) MEF (left panel) and ANA-1 cells (right panel) were infected with MCMV mutants 131stopB and Δm74 and MEF additionally with Δm74/m74trans. The latter mutant was trans-complemented with gO by growth in NIH3T3-gO cells. Virus was either preincubated with anti-MCK2 rabbit antiserum or with an anti-pUL131A rabbit antiserum, which served as a control rabbit antiserum, at a dilution of 1∶10, or with medium as a mock control. Infection of cells was monitored by indirect immunofluorescence staining for IE1+ cells 6 h after infection. The percentage of IE1+ cells is expressed relative to the percentage of IE1+ cells of mock-treated infections. As indicated, both, Δm74 MCMV and Δm74/m74trans MCMV were significantly (Student's t-test) inhibited by the MCK-2 antiserum when compared to the control rabbit antiserum. The P values are indicated in the histograms. Shown are means +/−SEM of 3 to 4 independent experiments. (B) MEF were infected with a Δm74/131stop mutant either grown in NIH3T3-gO (gO-trans) or NIH3T3-MCK-2 (MCK-2 trans) cells in the presence or absence of energy depletion medium, bafilomycin A1, or NH4Cl. Three hours after infection, cells were fixed and stained for IE1 expression. The percentage of IE1+ cells is expressed relative to the percentage of IE1+ cells of mock-treated infections. For all inhibitors, inhibition of the gO trans-complemented and of the MCK-2 trans-complemented mutant was significantly different (Student's t test). The P values are indicated in the histograms. Shown are means +/− SEM of 4 to 6 independent experiments.

Similar articles

Cited by

References

    1. Connolly SA, Jackson JO, Jardetzky TS, Longnecker R (2011) Fusing structure and function: a structural view of the herpesvirus entry machinery. Nat Rev Microbiol 9: 369–381. - PMC - PubMed
    1. Chowdary TK, Cairns TM, Atanasiu D, Cohen GH, Eisenberg RJ, et al. (2010) Crystal structure of the conserved herpesvirus fusion regulator complex gH-gL. Nat Struct Mol Biol 17: 882–888. - PMC - PubMed
    1. Matsuura H, Kirschner AN, Longnecker R, Jardetzky TS (2010) Crystal structure of the Epstein-Barr virus (EBV) glycoprotein H/glycoprotein L (gH/gL) complex. Proc Natl Acad Sci U S A 107: 22641–22646. - PMC - PubMed
    1. Li Q, Spriggs MK, Kovats S, Turk SM, Comeau MR, et al. (1997) Epstein-Barr virus uses HLA class II as a cofactor for infection of B lymphocytes. J Virol 71: 4657–4662. - PMC - PubMed
    1. Spriggs MK, Armitage RJ, Comeau MR, Strockbine L, Farrah T, et al. (1996) The extracellular domain of the Epstein-Barr virus BZLF2 protein binds the HLA-DR beta chain and inhibits antigen presentation. J Virol 70: 5557–5563. - PMC - PubMed

Publication types

MeSH terms

Grants and funding

BA was supported by the Deutsche Forschungsgemeinschaft through grants AD131/3-1 and AD131/3-2. NAWL was supported by the Young Investigators Program MAIFOR at the University Medical Center of the Johannes Gutenberg-University Mainz, and MJR by the Deutsche Forschungsgemeinschaft, Clinical Research Group KFO 183. The funders had no role in study design, data collection and analysis, decision to publish, or preparation of the manuscript.

LinkOut - more resources