Merkel polyomavirus-specific T cells fluctuate with merkel cell carcinoma burden and express therapeutically targetable PD-1 and Tim-3 exhaustion markers
- PMID: 23922299
- PMCID: PMC3790865
- DOI: 10.1158/1078-0432.CCR-13-0035
Merkel polyomavirus-specific T cells fluctuate with merkel cell carcinoma burden and express therapeutically targetable PD-1 and Tim-3 exhaustion markers
Abstract
Purpose: The persistent expression of Merkel cell polyomavirus (MCPyV) oncoproteins in Merkel cell carcinoma (MCC) provides a unique opportunity to characterize immune evasion mechanisms in human cancer. We isolated MCPyV-specific T cells and determined their frequency and functional status.
Experimental design: Multiparameter flow cytometry panels and HLA/peptide tetramers were used to identify and characterize T cells from tumors (n = 7) and blood (n = 18) of patients with MCC and control subjects (n = 10). PD-1 ligand (PD-L1) and CD8 expression within tumors were determined using mRNA profiling (n = 35) and immunohistochemistry (n = 13).
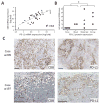
Results: MCPyV-specific CD8 T cells were detected directly ex vivo from the blood samples of 7 out of 11 (64%) patients with MCPyV-positive tumors. In contrast, 0 of 10 control subjects had detectable levels of these cells in their blood (P < 0.01). MCPyV-specific T cells in serial blood specimens increased with MCC disease progression and decreased with effective therapy. MCPyV-specific CD8 T cells and MCC-infiltrating lymphocytes expressed higher levels of therapeutically targetable PD-1 and Tim-3 inhibitory receptors compared with T cells specific to other human viruses (P < 0.01). PD-L1 was present in 9 of 13 (69%) MCCs and its expression was correlated with CD8-lymphocyte infiltration.
Conclusions: MCC-targeting T cells expand with tumor burden and express high levels of immune checkpoint receptors PD-1 and Tim-3. Reversal of these inhibitory pathways is therefore a promising therapeutic approach for this virus-driven cancer.
©2013 AACR.
Conflict of interest statement
The authors disclose no potential conflicts of interest.
Figures


Similar articles
-
Merkel cell polyomavirus-specific CD8⁺ and CD4⁺ T-cell responses identified in Merkel cell carcinomas and blood.Clin Cancer Res. 2011 Nov 1;17(21):6671-80. doi: 10.1158/1078-0432.CCR-11-1513. Epub 2011 Sep 9. Clin Cancer Res. 2011. PMID: 21908576 Free PMC article.
-
Tumor-Infiltrating Merkel Cell Polyomavirus-Specific T Cells Are Diverse and Associated with Improved Patient Survival.Cancer Immunol Res. 2017 Feb;5(2):137-147. doi: 10.1158/2326-6066.CIR-16-0210. Epub 2017 Jan 16. Cancer Immunol Res. 2017. PMID: 28093446 Free PMC article.
-
Merkel cell polyomavirus-specific immune responses in patients with Merkel cell carcinoma receiving anti-PD-1 therapy.J Immunother Cancer. 2018 Nov 27;6(1):131. doi: 10.1186/s40425-018-0450-7. J Immunother Cancer. 2018. PMID: 30482247 Free PMC article.
-
Insights into anti-tumor immunity via the polyomavirus shared across human Merkel cell carcinomas.Front Immunol. 2023 May 23;14:1172913. doi: 10.3389/fimmu.2023.1172913. eCollection 2023. Front Immunol. 2023. PMID: 37287968 Free PMC article. Review.
-
Merkel Cell Carcinoma in the Age of Immunotherapy: Facts and Hopes.Clin Cancer Res. 2018 May 1;24(9):2035-2043. doi: 10.1158/1078-0432.CCR-17-0439. Epub 2017 Dec 7. Clin Cancer Res. 2018. PMID: 29217527 Free PMC article. Review.
Cited by
-
Three-year survival, correlates and salvage therapies in patients receiving first-line pembrolizumab for advanced Merkel cell carcinoma.J Immunother Cancer. 2021 Apr;9(4):e002478. doi: 10.1136/jitc-2021-002478. J Immunother Cancer. 2021. PMID: 33879601 Free PMC article. Clinical Trial.
-
Prognostic Impact of MCPyV and TIL Subtyping in Merkel Cell Carcinoma: Evidence from a Large European Cohort of 95 Patients.Endocr Pathol. 2020 Mar;31(1):21-32. doi: 10.1007/s12022-019-09601-5. Endocr Pathol. 2020. PMID: 31808008
-
Merkel Cell Carcinoma: An Immunotherapy Fairy-Tale?Front Oncol. 2021 Sep 23;11:739006. doi: 10.3389/fonc.2021.739006. eCollection 2021. Front Oncol. 2021. PMID: 34631574 Free PMC article. Review.
-
T lymphocytes targeting native receptors.Immunol Rev. 2014 Jan;257(1):39-55. doi: 10.1111/imr.12133. Immunol Rev. 2014. PMID: 24329788 Free PMC article. Review.
-
The interplay between persistent pathogen infections with tumor microenvironment and immunotherapy in cancer.Cancer Med. 2024 Sep;13(17):e70154. doi: 10.1002/cam4.70154. Cancer Med. 2024. PMID: 39240588 Free PMC article. Review.
References
Publication types
MeSH terms
Substances
Grants and funding
- F30 ES019463/ES/NIEHS NIH HHS/United States
- R01 CA162522/CA/NCI NIH HHS/United States
- NIH-R01CA162522/CA/NCI NIH HHS/United States
- K24 CA139052/CA/NCI NIH HHS/United States
- T32 ES007032/ES/NIEHS NIH HHS/United States
- NIH-RO1094019/PHS HHS/United States
- R01 CA176841/CA/NCI NIH HHS/United States
- RC2 CA147820/CA/NCI NIH HHS/United States
- NIH-K24-CA139052/CA/NCI NIH HHS/United States
- R01 AI094019/AI/NIAID NIH HHS/United States
- NIH-F30ES019463-01/ES/NIEHS NIH HHS/United States
- NIH-RC2CA147820/CA/NCI NIH HHS/United States
- T32 GM007266/GM/NIGMS NIH HHS/United States
LinkOut - more resources
Full Text Sources
Other Literature Sources
Research Materials

