. 2013 Sep 11;32(18):2517-29.
doi: 10.1038/emboj.2013.172. Epub 2013 Aug 6.

NuMA phosphorylation by CDK1 couples mitotic progression with cortical dynein function

Affiliations

NuMA phosphorylation by CDK1 couples mitotic progression with cortical dynein function

Sachin Kotak et al. EMBO J. .

Abstract

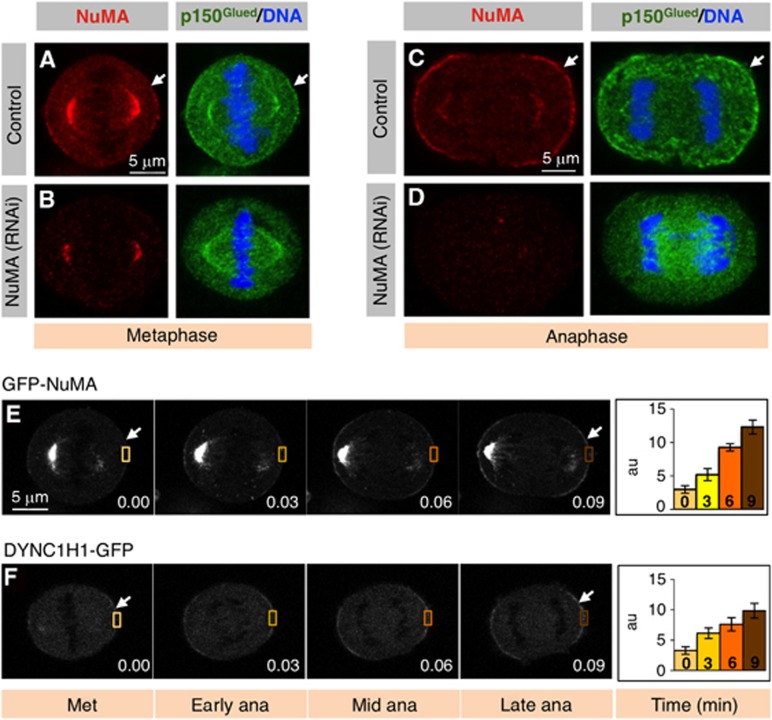
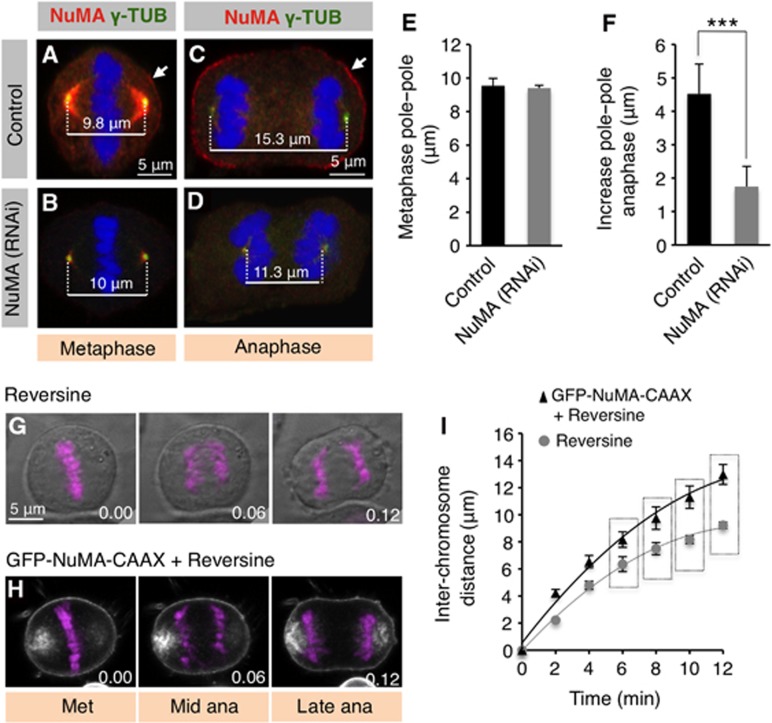
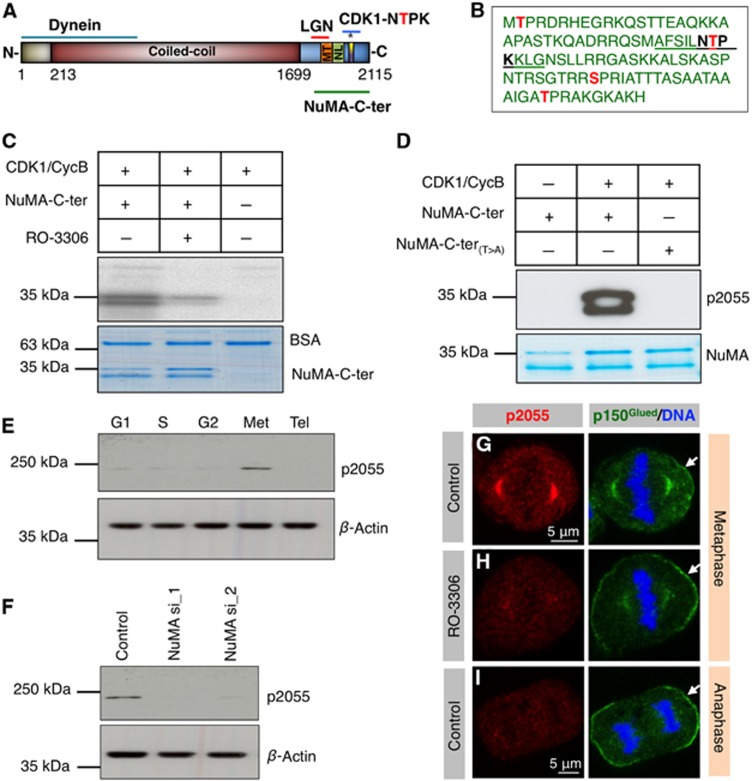
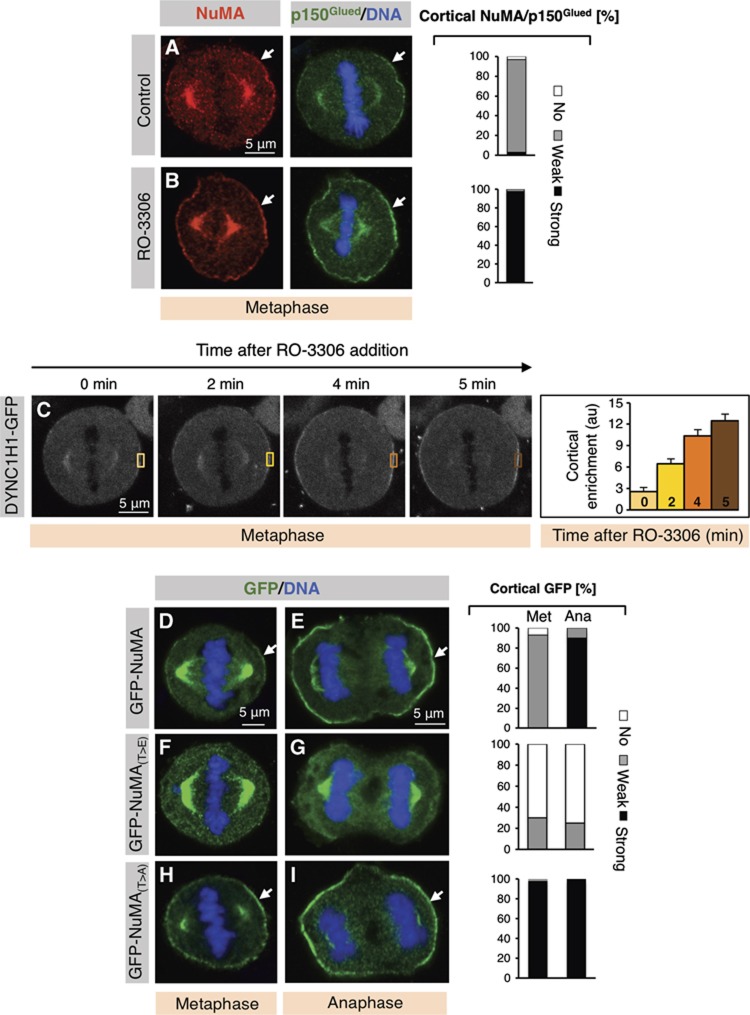
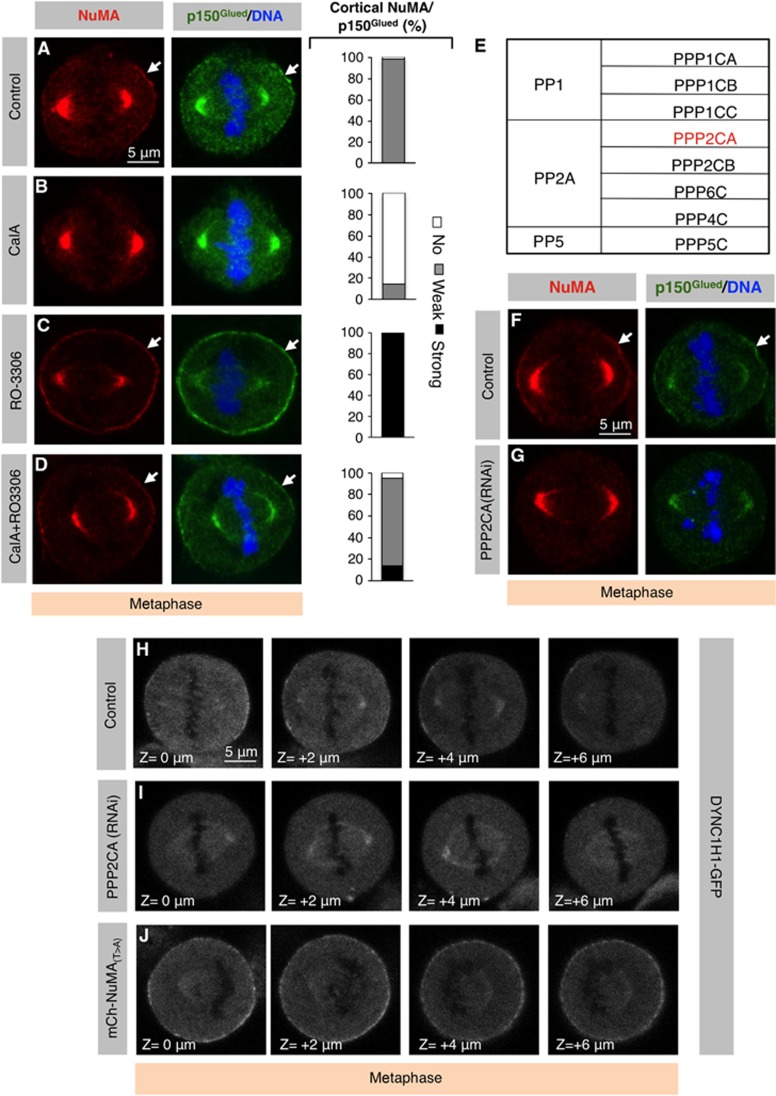
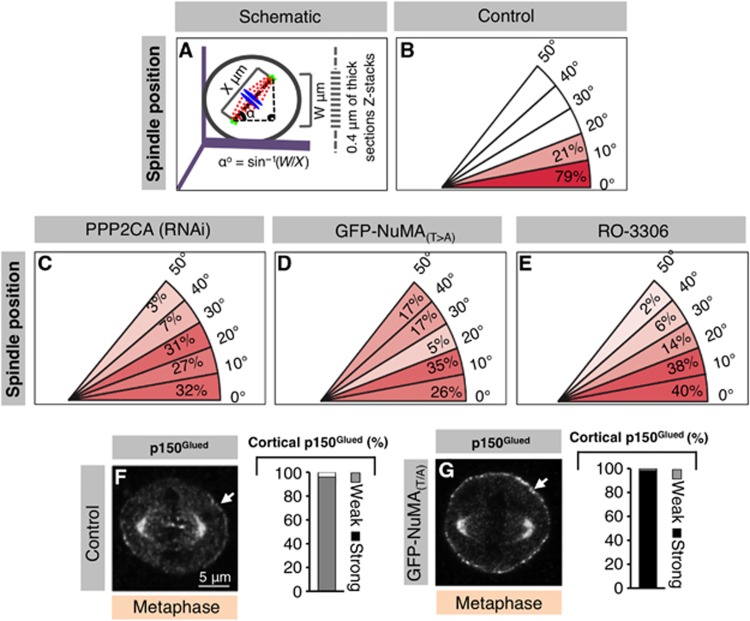
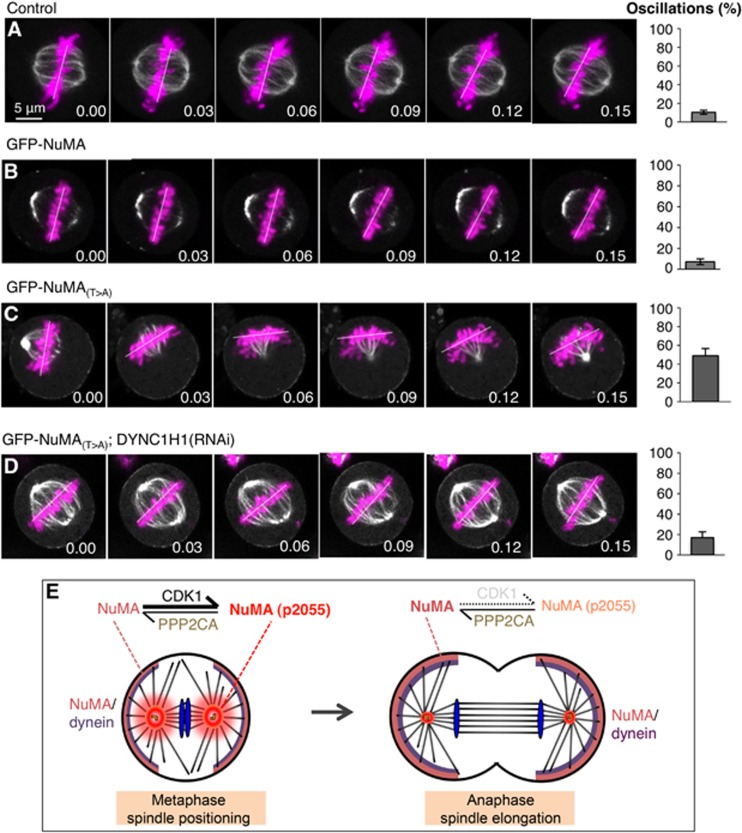
Spindle positioning and spindle elongation are critical for proper cell division. In human cells, an evolutionary conserved ternary complex (NuMA/LGN/Gαi) anchors dynein at the cortex during metaphase, thus ensuring correct spindle positioning. Whether this complex contributes to anaphase spindle elongation is not known. More generally, the mechanisms coupling mitotic progression with spindle behaviour remain elusive. Here, we uncover that levels of cortical dynein markedly increase during anaphase in a NuMA-dependent manner. We demonstrate that during metaphase, CDK1-mediated phosphorylation at T2055 negatively regulates NuMA cortical localization and that this phosphorylation is counteracted by PPP2CA phosphatase activity. We establish that this tug of war is essential for proper levels of cortical dynein and thus spindle positioning during metaphase. Moreover, we find that upon CDK1 inactivation in anaphase, the rise in dephosphorylated NuMA at the cell cortex leads to cortical dynein enrichment, and thus to robust spindle elongation. Our findings uncover a mechanism whereby the status of NuMA phosphorylation coordinates mitotic progression with proper spindle function.


Conflict of interest statement

The authors declare that they have no conflict of interest.

Figures

Figure 1
Figure 1
Cortical NuMA distribution increases during anaphase. (A–D) HeLa cells in metaphase (A, B) or anaphase (C, D) transfected with control siRNAs (A, C) or NuMA siRNAs (B, D), fixed 72 h thereafter and stained for NuMA (red) as well as p150Glued (green). In this and other figures, DNA is visualized in blue and arrows point to cortical localization. Only 3% and 5% of NuMA siRNA-treated cells exhibited some cortical p150Glued signal during metaphase (Met) and anaphase (ana), respectively, compared to 98% and 100% in control conditions, respectively (n>100 in all cases). (E, F) Images from time-lapse microscopy of HeLa Kyoto cells either transfected with GFP-NuMA (E) (see also corresponding Supplementary Movie S1) or stably expressing mouse dynein heavy chain (DYNC1H1-GFP; F) (see also corresponding Supplementary Movie S2). Quantification of GFP cortical enrichment (right) determined by calculating the mean intensity of cortical signal (area drawn) and subtracting from this value the mean intensity value in the cytoplasm (similar area) and correcting for background signal. Time is indicated in h.min. Stages of mitosis are indicated below the panels (n=5 cells, error bars: s.e.m.).
Figure 2
Figure 2
NuMA-dependent cortical dynein promotes spindle elongation during anaphase B. (A–D) Metaphase (A, B) and anaphase (C, D) cells transfected with control siRNAs (A, C) or NuMA siRNAs (B, D), fixed 96 h thereafter and stained for NuMA (red) as well as γ-tubulin (green). Pole-to-pole distances are indicated. (E, F) Quantification of pole-to-pole distances in metaphase (E) and increase over metaphase distances during anaphase (F). Two-tailed Student’s t-tests show that the anaphase pole-to-pole distance upon NuMA depletion is significantly different from that of control (***P<0.0005; n=50 for metaphase (Met) and n=43 for anaphase (ana), respectively). (G, H) Images from time-lapse microscopy of HeLa cells stably expressing mCherry-H2B and treated with Reversine (1 μM) (G) or transfected with GFP-NuMA-CAAX and treated with Reversine (H) (see also corresponding Supplementary Movies S5 and S6). The mCherry signal is shown in pink, overlaid on the phase image (G) or overlaid on the GFP image (H). Time is indicated in h.min. (I) Chromosome–chromosome distance in the conditions shown in (G) and (H). The significance determined using Student’s t-test is P<0.01 between the values highlighted by a vertical rectangle. Time is indicated in min (n=5 cells for each condition at each time point; error bars: s.d.).
Figure 3
Figure 3
CDK1 phosphorylates NuMA at T2055 during metaphase. (A) Schematic representation of NuMA, with coiled-coil domain and regions mediating interaction with dynein, LGN and microtubules (MT); the nuclear localization signal (NL) and the CDK1 consensus sequence encompassing T2055 are also depicted. (B) Stretch in the C-terminal part of NuMA (amino acids 2014–2115) that contains the four residues (red) identified by mass spectrometry (MS) to be in vitro phosphorylated by CDK1. The peptide used to raise phospho-T2055 antibodies is underlined. (C) In vitro kinase assay with C-terminal fragment of NuMA (NuMA-C-ter, see (A), amino acids 1876–2115) incubated with CDK1/CyclinB plus [γ-32P]-ATP either in the presence of 0.1% DMSO or the CDK1 inhibitor RO-3306 (9 μM) and analysed by autoradiography (top). Equal loading is shown by Coomassie staining (bottom); BSA serves as a negative control. In (CF), molecular mass is indicated in kDa. Note that bacterially expressed NuMA-C-ter is unstable, thus explaining the presence of two species. (D) In vitro kinase assay of wild-type or T2055A NuMA-C-ter (NuMA-C-ter(T>A)), as indicated, incubated with CDK1/CyclinB plus cold ATP and analysed by western blot using phospho-T2055 antibodies. (E) Western blot with phospho-T2055 antibodies of lysates from cells synchronized in the indicated stages of the cell cycle (G1, S, G2, metaphase (Met) and Telophase (Tel)). (F) Western blot with phospho-T2055 antibodies of lysates from cells treated with either control siRNAs or two independent siRNAs against NuMA (NuMA si_1 and NuMA si_2) and synchronized in metaphase. (G–I) HeLa cells in metaphase (G, H) or anaphase (I) stained with phospho-T2055 antibodies (red) and p150Glued (green). The cell in (H) has been treated in addition with RO-3306 (9 μM) for 5 min.
Figure 4
Figure 4
CDK1 negatively regulates NuMA/dynein cortical distribution by phosphorylating NuMA at T2055. (A, B) Metaphase HeLa cells treated with 0.1% DMSO (Control) (A) or RO-3306 (9 μM) (B) and stained for NuMA (red) as well as p150Glued (green). Stacked columns on the right show the extent of cortical NuMA/p150Glued, which was either absent (‘No’), ‘Weak’ (as for instance in (A)), or ‘Strong’ (as for instance in (B)) (n>100 in each condition; NuMA and p150Glued systematically colocalize and are thus reported together). (C) Time-lapse recording of HeLa cells expressing DYNC1H1-GFP and treated with RO-3306 (9 μM) for 5 min. Quantification of DYNC1H1-GFP cortical enrichment (right) determined by calculating the mean intensity of cortical signal (area drawn) and subtracting from this value the mean intensity value in the cytoplasm (similar area) and correcting for background signal (n=5, error bars: s.e.m.). (D–I) Metaphase and anaphase HeLa cells, as indicated, transfected with GFP-NuMA (D, E), GFP-NuMA(T>E) (F, G) or GFP-NuMA(T>A) (H, I), fixed 36 h thereafter and stained for GFP (green). Stacked columns on the right show the extent of cortical GFP localization in metaphase (Met) and anaphase (Ana), as mentioned above (n>60 in each condition except anaphase GFP-NuMA(T>E), where n=46).
Figure 5
Figure 5
A balance of CDK1 kinase and PPP2CA phosphatase activities determines the extent of cortical NuMA/dynein localization. (A–D) Metaphase HeLa cells treated with 0.1% DMSO (Control) (A), Calyculin A (CalA) (50 nM) (B), RO-3306 (9 μM) (C) or CalA plus RO-3306 (D), stained for NuMA (red) as well as p150Glued (green). Stacked column on the right shows the extent of cortical NuMA/p150Glued localization as explained in the legend of Figure 4 (n>100 in each condition). (E) The eight human PPP family catalytic subunits fall into three subgroups (PP1, PP2A and PP5). (F, G) Metaphase cells transfected with control siRNAs (F) or siRNAs against PPP2CA (G), fixed 72 h thereafter and stained for NuMA (red) as well as p150Glued (green). For quantification see Supplementary Figure S5B. (H–J) Z-projection of images that are 2 μm apart of metaphase cell stably expressing DYNC1H1-GFP and transfected with control siRNAs (H), PPP2CA siRNAs (I) or transfected with mCherry-NuMA(T>A) (J). Note loss of cortical DYNC1H1-GFP in cells transfected with siRNAs against PPP2CA and enrichment of DYNC1H1-GFP in cells expressing mcherry-NuMA(T>A). For each condition, 30 cells were analyzed and representative results are shown.
Figure 6
Figure 6
Appropriate levels of dynein mediated by opposing CDK1 and PPP2CA activities are necessary for proper metaphase spindle positioning. (A) Analysis of metaphase spindle positioning performed by computing the distance (X, μm) between the two spindle poles. The angle was calculated by imaging Z-stacks of 0.4 μm-thick sections and calculating the angle using an inverse trigonometric function, as illustrated. (B–E) Distribution of metaphase spindle angles with respect to the fibronectin substratum in cells transfected with Control siRNAs (B), PPP2CA siRNAs (C), cells transfected with GFP-NuMA(T>A) (D) or cells treated with RO-3306 (9 μM) (E). A minimum of 50 cells were analysed for each condition and the significance determined using a two-tailed Student’s t-test (P <0.0005 in C–E compared to B). (F, G) Untransfected control HeLa cells (F) or HeLa cells transfected with GFP-NuMA(T>A) (G) and stained for p150Glued (grey). Stacked columns on the right show the extent of cortical p150Glued localization in metaphase, similar to Figure 4 (n>100 in each condition).
Figure 7
Figure 7
Excess cortical NuMA causes dynein-dependent metaphase spindle oscillations. (A–D) Images from time-lapse recordings of metaphase HeLa Kyoto cells stably expressing GFP-α-tubulin as well as mCherry-H2B (A) and transfected with GFP-NuMA (B), or transfected with either GFP-NuMA(T>A) (C) or GFP-NuMA(T>A) and treated with DYNC1H1 siRNAs in addition (D) (see also corresponding Supplementary Movies S9–S12). The white line indicates the position of chromosomes. For each condition, 10 cells were imaged. The bar graphs on the right represent the frequency at which chromosome position changes >10° between two frames, along with the s.e.m. Two-tailed Student’s t-tests show that the extent of spindle oscillations upon overexpression of GFP-NuMA(T>A) is statistically different from that observed either in control conditions (P<0.0001) or upon overexpression of GFP-NuMA (P<0.0005), and that in GFP-NuMA(T>A) plus DYNC1H1 (RNAi) statistically different from the GFP-NuMA(T>A) condition (P<0.0005). Time is indicated in h.min. (E) Model for cortical localization of NuMA/dynein during metaphase and anaphase. During metaphase (left), the counteracting influences of CDK1 and PPP2CA phosphatases on T2055 results in the presence of moderate levels of unphosphorylated NuMA, and thus of dynein, at the cell cortex; such moderate levels are critical for ensuring proper spindle positioning. During anaphase, upon CDK1 inactivation and continued PPP2CA phosphatase activity, the balance is shifted towards unphosphorylated NuMA, thus leading to higher levels of cortical dynein, which are critical for robust spindle elongation during anaphase B.

Comment in

Similar articles

Cited by

References

    1. Aist JR, Berns MW (1981) Mechanics of chromosome separation during mitosis in Fusarium (Fungi imperfecti): new evidence from ultrastructural and laser microbeam experiments. J Cell Biol 91(2 Pt 1): 446–458 - PMC - PubMed
    1. Aist JR, Liang H, Berns MW (1993) Astral and spindle forces in PtK2 cells during anaphase B: a laser microbeam study. J Cell Sci 104(Pt 4): 1207–1216 - PubMed
    1. Axton JM, Dombradi V, Cohen PT, Glover DM (1990) One of the protein phosphatase 1 isoenzymes in Drosophila is essential for mitosis. Cell 63: 33–46 - PubMed
    1. Basto R, Pines J (2007) The centrosome opens the way to mitosis. Dev Cell 12: 475–477 - PubMed
    1. Cande WZ (1982) Inhibition of spindle elongation in permeabilized mitotic cells by erythro-9-[3-(2-hydroxynonyl)] adenine. Nature 295: 700–701 - PubMed

Publication types