Genetic reduction of the α1 subunit of Na/K-ATPase corrects multiple hippocampal phenotypes in Angelman syndrome
- PMID: 23911285
- PMCID: PMC3756897
- DOI: 10.1016/j.celrep.2013.07.005
Genetic reduction of the α1 subunit of Na/K-ATPase corrects multiple hippocampal phenotypes in Angelman syndrome
Abstract
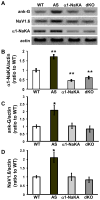
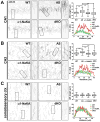
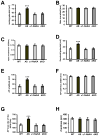
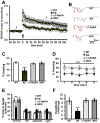
Angelman syndrome (AS) is associated with symptoms that include autism, intellectual disability, motor abnormalities, and epilepsy. We recently showed that AS model mice have increased expression of the alpha1 subunit of Na/K-ATPase (α1-NaKA) in the hippocampus, which was correlated with increased expression of axon initial segment (AIS) proteins. Our developmental analysis revealed that the increase in α1-NaKA expression preceded that of the AIS proteins. Therefore, we hypothesized that α1-NaKA overexpression drives AIS abnormalities and that by reducing its expression these and other phenotypes could be corrected in AS model mice. Herein, we report that the genetic normalization of α1-NaKA levels in AS model mice corrects multiple hippocampal phenotypes, including alterations in the AIS, aberrant intrinsic membrane properties, impaired synaptic plasticity, and memory deficits. These findings strongly suggest that increased expression of α1-NaKA plays an important role in a broad range of abnormalities in the hippocampus of AS model mice.
Copyright © 2013 The Authors. Published by Elsevier Inc. All rights reserved.
Figures


Comment in
-
Sodium-potassium ATPase emerges as a player in hippocampal phenotypes of Angelman syndrome mice.J Neurophysiol. 2014 Jul 1;112(1):5-8. doi: 10.1152/jn.00760.2013. Epub 2014 Feb 5. J Neurophysiol. 2014. PMID: 24501262 Free PMC article.
Similar articles
-
α1-Na/K-ATPase inhibition rescues aberrant dendritic calcium dynamics and memory deficits in the hippocampus of an Angelman syndrome mouse model.Prog Neurobiol. 2019 Nov;182:101676. doi: 10.1016/j.pneurobio.2019.101676. Epub 2019 Aug 8. Prog Neurobiol. 2019. PMID: 31401139
-
Sodium-potassium ATPase emerges as a player in hippocampal phenotypes of Angelman syndrome mice.J Neurophysiol. 2014 Jul 1;112(1):5-8. doi: 10.1152/jn.00760.2013. Epub 2014 Feb 5. J Neurophysiol. 2014. PMID: 24501262 Free PMC article.
-
Chronic α1-Na/K-ATPase inhibition reverses the elongation of the axon initial segment of the hippocampal CA1 pyramidal neurons in Angelman syndrome model mice.Neuropsychopharmacology. 2021 Feb;46(3):654-664. doi: 10.1038/s41386-020-00907-1. Epub 2020 Nov 19. Neuropsychopharmacology. 2021. PMID: 33214655 Free PMC article.
-
Alterations in intrinsic membrane properties and the axon initial segment in a mouse model of Angelman syndrome.J Neurosci. 2011 Nov 30;31(48):17637-48. doi: 10.1523/JNEUROSCI.4162-11.2011. J Neurosci. 2011. PMID: 22131424 Free PMC article.
-
Hormonal regulation of Na+/K+-dependent ATPase activity and pump function in corneal endothelial cells.Cornea. 2011 Oct;30 Suppl 1:S60-6. doi: 10.1097/ICO.0b013e318227faab. Cornea. 2011. PMID: 21912233 Review.
Cited by
-
Adult Ube3a Gene Reinstatement Restores the Electrophysiological Deficits of Prefrontal Cortex Layer 5 Neurons in a Mouse Model of Angelman Syndrome.J Neurosci. 2018 Sep 12;38(37):8011-8030. doi: 10.1523/JNEUROSCI.0083-18.2018. Epub 2018 Aug 6. J Neurosci. 2018. PMID: 30082419 Free PMC article.
-
Axon initial segments: diverse and dynamic neuronal compartments.Curr Opin Neurobiol. 2014 Aug;27:96-102. doi: 10.1016/j.conb.2014.03.004. Epub 2014 Apr 3. Curr Opin Neurobiol. 2014. PMID: 24705243 Free PMC article. Review.
-
Na+/K+-ATPase: ion pump, signal transducer, or cytoprotective protein, and novel biological functions.Neural Regen Res. 2024 Dec 1;19(12):2684-2697. doi: 10.4103/NRR.NRR-D-23-01175. Epub 2024 Jan 31. Neural Regen Res. 2024. PMID: 38595287 Free PMC article.
-
A distinct subtype of dopaminergic interneuron displays inverted structural plasticity at the axon initial segment.J Neurosci. 2015 Jan 28;35(4):1573-90. doi: 10.1523/JNEUROSCI.3515-14.2015. J Neurosci. 2015. PMID: 25632134 Free PMC article.
-
Angelman Syndrome.Neurotherapeutics. 2015 Jul;12(3):641-50. doi: 10.1007/s13311-015-0361-y. Neurotherapeutics. 2015. PMID: 26040994 Free PMC article. Review.
References
-
- Al-Mosalem OA, El-Ansary A, Attas O, Al-Ayadhi L. Metabolic biomarkers related to energy metabolism in Saudi autistic children. Clin Biochem. 2009;42:949–957. - PubMed
-
- Brodie C, Bak A, Shainberg A, Sampson SR. Role of Na-K ATPase in regulation of resting membrane potential of cultured rat skeletal myotubes. J Cell Physiol. 1987;130:191–198. - PubMed
-
- Chetcuti A, Adams LJ, Mitchell PB, Schofield PR. Microarray gene expression profiling of mouse brain mRNA in a model of lithium treatment. Psychiatr Genet. 2008;18:64–72. - PubMed
-
- Corti C, Xuereb JH, Crepaldi L, Corsi M, Michielin F, Ferraguti F. Altered levels of glutamatergic receptors and Na+/K+ ATPase-alpha1 in the prefrontal cortex of subjects with schizophrenia. Schizophr Res. 2011;128:7–14. - PubMed
Publication types
MeSH terms
Substances
Grants and funding
- NS078718/NS/NINDS NIH HHS/United States
- R01 NS034007/NS/NINDS NIH HHS/United States
- R01 NS047384/NS/NINDS NIH HHS/United States
- NS047384/NS/NINDS NIH HHS/United States
- R37 NS034007/NS/NINDS NIH HHS/United States
- R29 NS034007/NS/NINDS NIH HHS/United States
- NS073295/NS/NINDS NIH HHS/United States
- NS044916/NS/NINDS NIH HHS/United States
- R21 NS078718/NS/NINDS NIH HHS/United States
- R37 NS044916/NS/NINDS NIH HHS/United States
- R01 NS044916/NS/NINDS NIH HHS/United States
- F31 NS073295/NS/NINDS NIH HHS/United States
- NS034007/NS/NINDS NIH HHS/United States
LinkOut - more resources
Full Text Sources
Other Literature Sources
Molecular Biology Databases
Research Materials
Miscellaneous

