. 2013 Oct;87(20):11008-18.
doi: 10.1128/JVI.01633-13. Epub 2013 Jul 31.

Dystonin/BPAG1 promotes plus-end-directed transport of herpes simplex virus 1 capsids on microtubules during entry

Affiliations

Dystonin/BPAG1 promotes plus-end-directed transport of herpes simplex virus 1 capsids on microtubules during entry

Marion McElwee et al. J Virol. 2013 Oct.

Abstract

During infection by herpes simplex virus 1 (HSV-1), the viral capsid is transported around the cytoplasm along the microtubule (MT) network. Although molecular motors have been implicated in this process, the composition of the molecular machinery required for efficient directional transport is unknown. We previously showed that dystonin (BPAG1) is recruited to HSV-1 capsids by the capsid-bound tegument protein pUL37 to promote efficient cytoplasmic transport of capsids during egress. Dystonin is a cytoskeleton cross-linker which localizes at MT plus ends and has roles in retrograde and anterograde transport in neurons. In this study, we investigated the role of dystonin during the entry stages of HSV-1 infection. Because of the way in which the MT network is organized, capsids are required to change their direction of motion along the MTs as they travel from the point of entry to the nucleus, where replication takes place. Thus, capsids first travel to the centrosome (the principal microtubule organizing center) by minus-end-directed transport and then switch polarity and travel to the nucleus by plus-end-directed transport. We observed that transport of capsids toward the centrosome was slowed, but not blocked, by dystonin depletion. However, transport of capsids away from the centrosome was significantly impaired, causing them to accumulate in the vicinity of the centrosome and reducing the numbers reaching the nucleus. We conclude that, during entry of HSV-1, dystonin has a specific role in plus-ended transport of capsids from the centrosome to the nucleus.


Figures
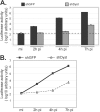
Fig 1
Fig 1
Initiation of HSV-1 replication in dystonin-depleted and control cells. (A) shGFP or shDyst HFFF2 cells were infected with 5 PFU/cell of tsK/luci and incubated for 2 h, 4 h, or 7 h at a permissive temperature (31°C). Cells were then harvested and lysed and luciferase activity was measured. Dashed line, background level. (B) Data shown in panel A are represented as a graph to show the rate of increase in luciferase levels with time after infection. mi, mock infected.
Fig 2
Fig 2
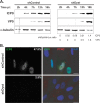
Onset of viral protein production in dystonin-depleted and control cells assessed by Western blotting and immunofluorescence analysis. (A) shControl or shDyst HFFF2 cells were infected with 5 PFU/cell of WT HSV-1. Cells were harvested at 2 h, 4 h, 7 h, 12 h, or 16 h after infection, and the levels of the immediate early protein ICP0 and of the late capsid protein VP5 were monitored using antibodies 11060 and DM165, respectively. Alpha-tubulin was detected using MAb DM1A and was used as a loading control. Protein quantities were normalized to the amount of alpha-tubulin, and the relative levels of ICP0 and VP5 in shDyst and shLuc cells were calculated. (B) ShControl or shDyst HFFF2 cells were infected with 1 PFU/cell of WT HSV-1. At 3 h after infection, the cells were fixed and stained for ICP0 (green) or capsids (red) using antibodies 11060 and PTNC, respectively. The numbers indicate the percentages of cells that were ICP0 positive out of 69 shControl cells and 80 shDyst cells counted.
Fig 3
Fig 3
Onset of viral protein production in dystonin-depleted and control cells assessed by FACS analysis. (A) Mock-infected shControl cells or shControl or shDyst HFFF2 cells infected with 5 PFU/cell of WT HSV-1 were harvested at 2 h, 4 h, or 6 h after infection, fixed, permeabilized, and incubated with antibody 11060 against ICP0 and GAM488. Cells were then analyzed by flow cytometry. The numbers of fluorescing cells and their fluorescence intensities were determined for mock-infected shControl cells (black line), infected shControl cells (blue line), or infected shDyst cells (red line). The percentages of the total cell population identified as positive (i.e., above the background level, as defined by the fluorescence intensity of the mock-infected shControl cells) are indicated using the same color coding. (B) Summary of mean fluorescence intensities indicated for panel A. The number of cells analyzed is given for each condition. Dashed line, background level defined by the fluorescence intensity of mock-infected shControl cells.
Fig 4
Fig 4
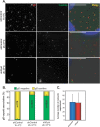
Virus penetration in dystonin-depleted and control cells. (A) shControl and shDyst HFFF2 cells were incubated with vSR27-VP26GFP virions for 1 h at 4°C or for 2 h at 37°C. The cells were fixed and labeled for gD with MAb 4846 and GAM568 (red). Capsids were visualized through GFP fluorescence (green). Nuclei were visualized with DAPI (blue). Bars, 20 μm. (B) The total numbers of capsids present on randomly chosen cells from the experiment whose results are shown in panel A were counted, and the proportion having envelopes was determined by colocalization between GFP (capsid) and Alexa Fluor 568 (envelope) signals. Results are shown as the numbers of gD-positive (yellow) and gD-negative (green) capsids expressed as a percentage of the total number of capsids counted. (C) Average number of cytosolic (gD-negative) capsids per cell at 37°C. A total of 270 (ShControl, 4°C), 1,870 (shControl, 37°C), and 1,836 (shDyst, 37°C) particles were analyzed in 27, 43, and 46 cells, respectively.
Fig 5
Fig 5
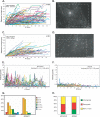
Impact of dystonin reduction on capsid transport during entry. shControl (A, B, and E) or shDyst (C, D, and F) HFFF2 cells were infected with 50 PFU/cell of vSR27-VP26GFP. Starting at 45 min after infection, cytoplasmic capsid movements were monitored by live-cell imaging at a rate of one frame per second. Results for each individual capsid tracked are plotted as the distance to the origin (A and C) or as the velocity (E and F) for each frame. The premature truncation of some lines is due to the capsids moving out of the field of view. A representative cell with all capsid trajectories plotted is shown for each condition (B and D). Dashed boxes, the area displayed in the corresponding movies (see Movies S1 and S2 in the supplemental material, respectively). Bars, 10 μm. (G) Summary of the maximum distances to the origin taken from the data shown in panels A and C as percentages of cells in categories of the distance to the origin. (H) Every moving capsid was tracked individually, and its directionality was estimated according to the position of the nucleus. Results are shown as the percentage of capsids having overall retrograde (away from the cell periphery and toward the nucleus) or anterograde (away from the nucleus and toward the cell periphery) motion. Both or none, either a capsid having opposite directionalities within the same run, a capsid that was not moving, or a capsid where the direction of movement relative to the nucleus could not be categorized.
Fig 6
Fig 6
Effect of dystonin silencing on capsid localization during entry. ShControl or shDyst HFFF2 cells were infected with 25 PFU/cell of WT HSV-1 for 3 h at 37°C in the presence of 100 μg/ml cycloheximide before being fixed. (A) Capsids were visualized with the rabbit anticapsid antibody PTNC and GAR568 (red), and centrosomes were visualized with MAb GTU-88 against gamma-tubulin and GAM488 (green). Nuclei were visualized with DAPI (blue). z-stacks of the whole-cell thickness were collected and are shown here in projection. Arrowheads, centrosomes; white circles, an area of 9 μm2 centered on the centrosome excluding any overlapping nuclear area. The density of capsids (in number of capsids per μm2 of surface [c/μm2]; see below) in each circle is specified. (B) Nuclear capsids (defined as capsids present within the DAPI-labeled area) and centrosomal capsids (defined as capsids present within the area delineated by the white circles) were counted. A total of 2,102 capsids were counted in 19 shControl cells and 1,083 capsids were counted in 11 shDyst cells. The nuclear and centrosomal surface areas were calculated using Zeiss Axiovision software, and the number of capsids per μm2 of surface (capsid density) was calculated. Asterisks indicate statistical differences (t test; *, P < 0.01; **, P = 0.001).
Fig 7
Fig 7
Capsid trafficking in the vicinity of the centrosome. shControl or shDyst HFFF2 cells were infected with 50 PFU/cell of vSR27-VP26GFP at 37°C. (A) shControl cells were fixed at 3 h postinfection and stained for microtubules with an antibody directed against alpha-tubulin and GAM568 (red). Capsids were visualized through direct GFP fluorescence (green). White arrowhead, MTOC. Bar, 20 μm. (B, C) shControl or shDyst cells were infected for 45 min at 37°C, and capsid trafficking was monitored by time-lapse microscopy at room temperature (see Movies S3 and S4 in the supplemental material, respectively). Capsid movement was visualized through a maximum-intensity projection of the whole time-lapse stack and interpreted as moving to (red) or from (yellow) the centrosome. (D) A total of 1,219 capsids from 114 different movies were tracked in shControl (n = 32) and shDyst (n = 32) HFFF2 cells. Their motion relative to the centrosome was determined and plotted as a percentage of the total number of capsids tracked.

Similar articles

Cited by

References

    1. Mabit H, Nakano MY, Prank U, Saam B, Dohner K, Sodeik B, Greber UF. 2002. Intact microtubules support adenovirus and herpes simplex virus infections. J. Virol. 76:9962–9971. - PMC - PubMed
    1. Sodeik B, Ebersold MW, Helenius A. 1997. Microtubule-mediated transport of incoming herpes simplex virus 1 capsids to the nucleus. J. Cell Biol. 136:1007–1021. - PMC - PubMed
    1. Bartolini F, Gundersen GG. 2006. Generation of noncentrosomal microtubule arrays. J. Cell Sci. 119:4155–4163. - PubMed
    1. Radtke K, Kieneke D, Wolfstein A, Michael K, Steffen W, Scholz T, Karger A, Sodeik B. 2010. Plus- and minus-end directed microtubule motors bind simultaneously to herpes simplex virus capsids using different inner tegument structures. PLoS Pathog. 6:e1000991. 10.1371/journal.ppat.1000991. - DOI - PMC - PubMed
    1. Kramer T, Greco TM, Taylor MP, Ambrosini AE, Cristea IM, Enquist LW. 2012. Kinesin-3 mediates axonal sorting and directional transport of alphaherpesvirus particles in neurons. Cell Host Microbe 12:806–814. - PMC - PubMed

Publication types