Effects of the number of genome segments on primary and systemic infections with a multipartite plant RNA virus
- PMID: 23903837
- PMCID: PMC3807391
- DOI: 10.1128/JVI.01402-13
Effects of the number of genome segments on primary and systemic infections with a multipartite plant RNA virus
Abstract
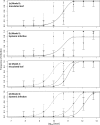
Multipartite plant viruses were discovered because of discrepancies between the observed dose response and predictions of the independent-action hypothesis (IAH) model. Theory suggests that the number of genome segments predicts the shape of the dose-response curve, but a rigorous test of this hypothesis has not been reported. Here, Alfalfa mosaic virus (AMV), a tripartite Alfamovirus, and transgenic Nicotianatabacum plants expressing no (wild type), one (P2), or two (P12) viral genome segments were used to test whether the number of genome segments necessary for infection predicts the dose response. The dose-response curve of wild-type plants was steep and congruent with the predicted kinetics of a multipartite virus, confirming previous results. Moreover, for P12 plants, the data support the IAH model, showing that the expression of virus genome segments by the host plant can modulate the infection kinetics of a tripartite virus to those of a monopartite virus. However, the different types of virus particles occurred at different frequencies, with a ratio of 116:45:1 (RNA1 to RNA2 to RNA3), which will affect infection kinetics and required analysis with a more comprehensive infection model. This analysis showed that each type of virus particle has a different probability of invading the host plant, at both the primary- and systemic-infection levels. While the number of genome segments affects the dose response, taking into consideration differences in the infection kinetics of the three types of AMV particles results in a better understanding of the infection process.
Figures


Similar articles
-
Engineering of alfalfa mosaic virus RNA 3 into an expression vector.Arch Virol. 2001;146(5):923-39. doi: 10.1007/s007050170125. Arch Virol. 2001. PMID: 11448030
-
RNAs 1 and 2 of Alfalfa mosaic virus, expressed in transgenic plants, start to replicate only after infection of the plants with RNA 3.J Gen Virol. 2001 Jan;82(Pt 1):25-28. doi: 10.1099/0022-1317-82-1-25. J Gen Virol. 2001. PMID: 11125154
-
Within-host Evolution of Segments Ratio for the Tripartite Genome of Alfalfa Mosaic Virus.Sci Rep. 2017 Jul 10;7(1):5004. doi: 10.1038/s41598-017-05335-8. Sci Rep. 2017. PMID: 28694514 Free PMC article.
-
Long-distance movement of helical multipartite phytoviruses: keep connected or die?Curr Opin Virol. 2018 Dec;33:120-128. doi: 10.1016/j.coviro.2018.07.016. Epub 2018 Sep 7. Curr Opin Virol. 2018. PMID: 30199788 Review.
-
Early events in virus-plant interactions.Braz J Med Biol Res. 1994 Nov;27(11):2521-32. Braz J Med Biol Res. 1994. PMID: 7549971 Review.
Cited by
-
Recombinase Polymerase Amplification Assay with and without Nuclease-Dependent-Labeled Oligonucleotide Probe.Int J Mol Sci. 2021 Nov 2;22(21):11885. doi: 10.3390/ijms222111885. Int J Mol Sci. 2021. PMID: 34769313 Free PMC article.
-
The Strange Lifestyle of Multipartite Viruses.PLoS Pathog. 2016 Nov 3;12(11):e1005819. doi: 10.1371/journal.ppat.1005819. eCollection 2016 Nov. PLoS Pathog. 2016. PMID: 27812219 Free PMC article. Review.
-
Unresolved advantages of multipartitism in spatially structured environments.Virus Evol. 2021 Jan 25;7(1):veab004. doi: 10.1093/ve/veab004. eCollection 2021 Jan. Virus Evol. 2021. PMID: 33614160 Free PMC article.
-
Nanovirus Disease Complexes: An Emerging Threat in the Modern Era.Front Plant Sci. 2020 Nov 19;11:558403. doi: 10.3389/fpls.2020.558403. eCollection 2020. Front Plant Sci. 2020. PMID: 33329624 Free PMC article. Review.
-
Engineered Functional Redundancy Relaxes Selective Constraints upon Endogenous Genes in Viral RNA Genomes.Genome Biol Evol. 2018 Jul 1;10(7):1823-1836. doi: 10.1093/gbe/evy141. Genome Biol Evol. 2018. PMID: 29982435 Free PMC article.
References
-
- Nelson MI, Viboud C, Simonsen L, Bennett RT, Griesemer SB, George KS, Taylor J, Spiro DJ, Sengamalay NA, Ghedin E, Taubenberger JK, Holmes EC. 2008. Multiple reassortment events in the evolutionary history of H1N1 Influenza A virus since 1918. PLoS Pathog. 4:e1000012.10.1371/journal.ppat.1000012 - DOI - PMC - PubMed
-
- Jaspars EM. 1974. Plant viruses with a multipartite genome. Adv. Virus Res. 19:37–149 - PubMed
-
- Gronenborn B. 2004. Nanoviruses: genome organisation and protein function. Vet. Microbiol. 98:103–109 - PubMed
-
- Fulton RW. 1962. Effect of dilution on Necrotic ringspot virus infectivity and enhancement of infectivity by noninfective virus. Virology 18:477–485 - PubMed
Publication types
MeSH terms
Substances
LinkOut - more resources
Full Text Sources
Other Literature Sources

