. 2013 Sep 13;288(37):26785-99.
doi: 10.1074/jbc.M112.446880. Epub 2013 Jul 26.

The core microprocessor component DiGeorge syndrome critical region 8 (DGCR8) is a nonspecific RNA-binding protein

Affiliations

The core microprocessor component DiGeorge syndrome critical region 8 (DGCR8) is a nonspecific RNA-binding protein

Braden M Roth et al. J Biol Chem. .

Abstract

MicroRNA (miRNA) biogenesis follows a conserved succession of processing steps, beginning with the recognition and liberation of an miRNA-containing precursor miRNA hairpin from a large primary miRNA transcript (pri-miRNA) by the Microprocessor, which consists of the nuclear RNase III Drosha and the double-stranded RNA-binding domain protein DGCR8 (DiGeorge syndrome critical region protein 8). Current models suggest that specific recognition is driven by DGCR8 detection of single-stranded elements of the pri-miRNA stem-loop followed by Drosha recruitment and pri-miRNA cleavage. Because countless RNA transcripts feature single-stranded-dsRNA junctions and DGCR8 can bind hundreds of mRNAs, we explored correlations between RNA binding properties of DGCR8 and specific pri-miRNA substrate processing. We found that DGCR8 bound single-stranded, double-stranded, and random hairpin transcripts with similar affinity. Further investigation of DGCR8/pri-mir-16 interactions by NMR detected intermediate exchange regimes over a wide range of stoichiometric ratios. Diffusion analysis of DGCR8/pri-mir-16 interactions by pulsed field gradient NMR lent further support to dynamic complex formation involving free components in exchange with complexes of varying stoichiometry, although in vitro processing assays showed exclusive cleavage of pri-mir-16 variants bearing single-stranded flanking regions. Our results indicate that DGCR8 binds RNA nonspecifically. Therefore, a sequential model of DGCR8 recognition followed by Drosha recruitment is unlikely. Known RNA substrate requirements are broad and include 70-nucleotide hairpins with unpaired flanking regions. Thus, specific RNA processing is likely facilitated by preformed DGCR8-Drosha heterodimers that can discriminate between authentic substrates and other hairpins.

Keywords: DGCR8; Double-stranded RNA-binding Domain (dsRBD); Drosha; MicroRNA; Microprocessor; NMR; Protein-Nucleic Acid Interaction; RNA Structure; RNA-binding Protein.


Figures
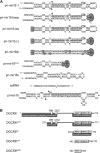
FIGURE 1.
FIGURE 1.
Constructs used in DGCR8/pri-miRNA experiments. A, Mfold (73)-predicted secondary structures of in vitro transcripts. Dark boxes represent sequence mutations; arrows indicate Drosha cleavage sites, and open boxes highlight mature miRNA sequences. The ssRNA construct is an unstructured 87-nt transcript containing nine repeats of the bracketed sequence. pri-mir-16x is an Mfold-predicted 82-nt hairpin located 397 nt upstream of pri-mir-16-1. B, full-length and truncated DGCR8 constructs are shown in the context of functionally significant domains. WW refers to the proline-binding WW domain; C352 is a cysteine required for heme coordination; RBDs are RNA-binding motifs, and DI refers to the Drosha-interaction/trimerization domain.
FIGURE 2.
FIGURE 2.
NMR-based secondary structure confirmation of pri-mir-16-1 variants. 800 MHz imino one-dimensional jump-return echo experiments were collected at 298 K. A, pri-mir-16ΔΔ RNA. The spectrum is labeled with assignment information; numbering is consistent with full-length pri-mir-16-1 (Fig. 1A). The imino resonances labeled α, ζ, and η are located in the non-native Gα:C-C:Gη clamp and 5′-UUCGζ-3′ tetraloop capping pri-mir-16ΔΔ and pri-mir-16Δloop, respectively, and connected using dashed drop-lines. B, pri-mir-16Δss. C, pri-mir-16Δloop. D, pri-mir-16-1 RNA.
FIGURE 3.
FIGURE 3.
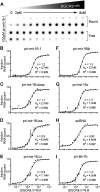
Filter binding measurement of DGCR8 binding affinity. A, representative raw data from dot-blot double filter binding experiments. Protein concentration increases from 2 pm to 8 μm spanning two bracketed rows. B–I, quantified results of recombinant DGCR8Δ275/RNA binding, represented as the fraction of bound RNA. All experiments were performed with 100 pm 32P-5′-end-labeled RNA. The axes of all graphs are identical, and the values are shown along the left and bottom of the figure. All curves have been calculated from at least four independent experiments.
FIGURE 4.
FIGURE 4.
EMSA visualization of DGCR8-pri-mir-16-1 complex stoichiometries and apparent affinities. A, representative gel shifts of pri-mir-16-1 with DGCR8 variants exhibit similar formation of higher order complexes. B, EMSA titration of DGCR8core into pri-mir-16-1 RNA, with the bands corresponding to free pri-mir-16-1, multimeric DGCR8core·pri-mir-16-1 complexes, and DGCR8core concentration through the titration denoted. EMSA reaction buffers contained 40, 20, and 4 μg ml−1 of nonspecific competitor yeast tRNAPhe (Sigma), respectively.
FIGURE 5.
FIGURE 5.
NMR imino assignments and secondary structure determination of pri-mir-16lower. A, sequential imino-imino proton NOE assignment paths are shown by different colors for A-form helical stems I (black), II (magenta), and III (cyan). The spectrum is labeled with assignment information. B, NMR-based secondary structure of the lower stem of pri-mir-16lower. The secondary structure representation was generated using PseudoViewer (74); pri-mir-16lower numbering is consistent with full-length pri-mir-16-1 (Fig. 1).
FIGURE 6.
FIGURE 6.
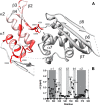
Chemical shift perturbation analysis of DGCR8RBD1 and DGCR8core constructs. A, color-coded representation of combined backbone amide 1HN and 15N chemical shift differences of DGCR8RBD1 (residues 509–582) and DGCR8core (residues 493–706). Backbone ribbon color of the DGCR8 crystal structure (PDB code 2YT4) varies between white (Δδ = 0 ppm) and red (Δδ ≥0.2 ppm). Residues Val-581 and Lys-582 (Δδ ≥ 0.6 ppm) at the very C-terminal end of the RBD1 construct have been omitted for clarity. Side chains of residues with Δδ ≥0.2 ppm are shown. The location of a putative salt bridge involving Asp-549 and Lys-659 (italic) inferred from the distances observed in the x-ray structure is indicated using arrows. B, backbone amide 1HN and 15N chemical shift differences of DGCR8RBD1 (residues 509–582) in comparison with DGCR8core (residues 493–706) as a function of residue number. Secondary structure elements are numbered and highlighted using gray boxes.
FIGURE 7.
FIGURE 7.
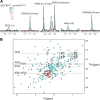
DGCR8core·pri-mir-16lower complex formation monitored by NMR. A, traces taken through the TROSY cross-peaks of Arg-522 (located in α1), Glu-540 (β2-β3 loop), Lys-590 (α2-α3 interdomain loop)/Met-705 (C terminus), His-625 (α6), and Gly-646 (β5-β6 loop) during the titration at various 2H,15N-DGCR8core:pri-mir-16lower stoichiometric ratios ranging from 48:1 (black) to 1:2 (red). B, 800 MHz 1H,15N TROSY spectra of 2H,15N-DGCR8core recorded at 25 °C in the absence of pri-mir-16lower (cyan contours) and at protein:RNA stoichiometric ratios of 48:1 (single black contour) and 1:2 (red contours). Dashed-horizontal lines indicate traces shown in A with cross-peak positions circled and assignments given.
FIGURE 8.
FIGURE 8.
1H,15N-TROSY resonance broadening map for binding of DGCR8core to pri-mir-16lower. A, changes in 1H LW (ΔLW) of 250 μm 2H,15N-labeled DGCR8core in the presence of 10.4 μm pri-mir-16lower versus the amino acid sequence of DGCR8core. ΔLW values were calculated by subtracting the LWbound of a given residue from the LWfree. ΔLW for infinitely broadened resonances (gray bars) were calculated assuming a conservative LWbound of 50 Hz corresponding to the largest 1H-TROSY LWbound observable at 800 MHz. Secondary structure elements (α1–7 and β1–7) as determined by chemical shift index using TALOS+ (75) are identified below the residue number. B, color-coded worm representation of DGCR8core/pri-mir-16lower titration at a 24:1 protein/RNA ratio. Secondary structure elements are numbered and indicated. Worm thickness of the DGCR8core crystal structure (PDB code 2YT4) varies between 2.00 (ΔLW = −38.3 Hz, red) and 0.25 (ΔLW = 9.2 Hz, blue). Missing crystal residues were modeled and energy-minimized in Chimera (76). C, DGCR8core/pri-mir-16lower titration at a 1:2 protein/RNA ratio. Individual RBDs are numbered; N and C termini are shown and indicated. The 39 visible TROSY peaks remaining in the presence of excess RNA predominantly map to the N and C termini, and flexible linker regions of the DGCR8core crystal structure (PDB code 2YT4) and are mapped and highlighted in blue on the protein sequence (A).
FIGURE 9.
FIGURE 9.
pri-mir-16lower·DGCR8core complex formation monitored by NMR. A, 850 MHz imino one-dimensional jump-return echo experiment of pri-mir-16lower collected at 298 K (black) labeled with assignment information; numbering is consistent with full-length pri-mir-16-1 (Fig. 1). RNA/protein molar ratios ranging from 48:1 (orange) to 1:1 (gray) were achieved by adding dilute aliquots of DGCR8core to a 250 μm pri-mirlower sample in NMR buffer. B, same as above with 5 mm MgCl2 added to the NMR buffer.
FIGURE 10.
FIGURE 10.
Pulsed field gradient NMR and DGCR8-pri-mir-16-1 complex models. A, natural log scale of signal integrals of BPPLED-PFG 1H NMR experiments as a function of gradient amplitude squared and linear data fits. Diffusion of individual protein and RNA components is as follows: DGCR8RBD1 (red), DGCR8core (blue), pri-mir-16lower (green), and DGCR8PC (black). B, diffusion of 1:2 molar ratio DGCR8core·pri-mir-16lower complexes as follows: average (dashed red line), lower limit (solid blue line), and upper limit (dashed black line). The inset (G2-G02 = 0.00 to 0.05, ln(1/I0) = 0.0 to −0.5) in the upper right corner shows the best fit for the upper complex limit (dashed black line).
FIGURE 11.
FIGURE 11.
In vitro pri-miRNA processing assays. A, processing of uniformly labeled pri-miRNAs in the absence (Input) or in the presence (c-myc-IP) of immunoprecipitated Microprocessor. Assays were performed as described under “Experimental Procedures.” Sizes of oligonucleotide DNA markers are shown on the left. 5′, 3′, and pre-miRNA processing products are indicated on the right. B, DGCR8Δ275-dependent pri-miRNA processing. Recombinant DGCR8Δ275 was incubated with stringently washed IP-Drosha. 32P-5′-End-labeled pri-mir-16-1 variants were incubated in the absence (−) or presence (+) of Microprocessor components. Images in A and B are representative of at least two independent experiments.

Similar articles

Cited by

References

    1. Bartel D. P. (2009) MicroRNAs: target recognition and regulatory functions. Cell 136, 215–233 - PMC - PubMed
    1. Voinnet O. (2009) Origin, biogenesis, and activity of plant microRNAs. Cell 136, 669–687 - PubMed
    1. Dreyer J. L. (2010) New insights into the roles of microRNAs in drug addiction and neuroplasticity. Genome Med. 2, 92. - PMC - PubMed
    1. Farazi T. A., Spitzer J. I., Morozov P., Tuschl T. (2011) miRNAs in human cancer. J. Pathol. 223, 102–115 - PMC - PubMed
    1. Ferland-McCollough D., Ozanne S. E., Siddle K., Willis A. E., Bushell M. (2010) The involvement of microRNAs in type 2 diabetes. Biochem. Soc. Trans. 38, 1565–1570 - PubMed

Publication types

LinkOut - more resources