

Mitochondrial function in human neuroblastoma cells is up-regulated and protected by NQO1, a plasma membrane redox enzyme
- PMID: 23874855
- PMCID: PMC3708898
- DOI: 10.1371/journal.pone.0069030
Mitochondrial function in human neuroblastoma cells is up-regulated and protected by NQO1, a plasma membrane redox enzyme
Abstract
Background: Recent findings suggest that NADH-dependent enzymes of the plasma membrane redox system (PMRS) play roles in the maintenance of cell bioenergetics and oxidative state. Neurons and tumor cells exhibit differential vulnerability to oxidative and metabolic stress, with important implications for the development of therapeutic interventions that promote either cell survival (neurons) or death (cancer cells).
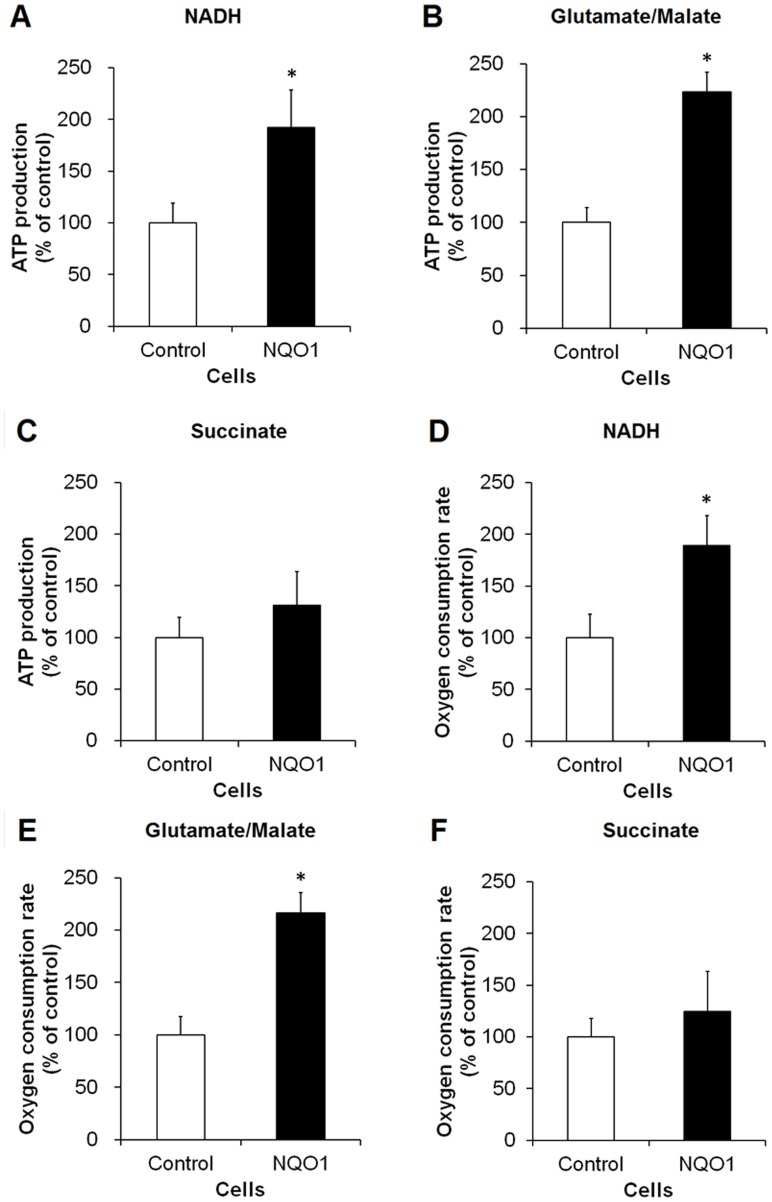
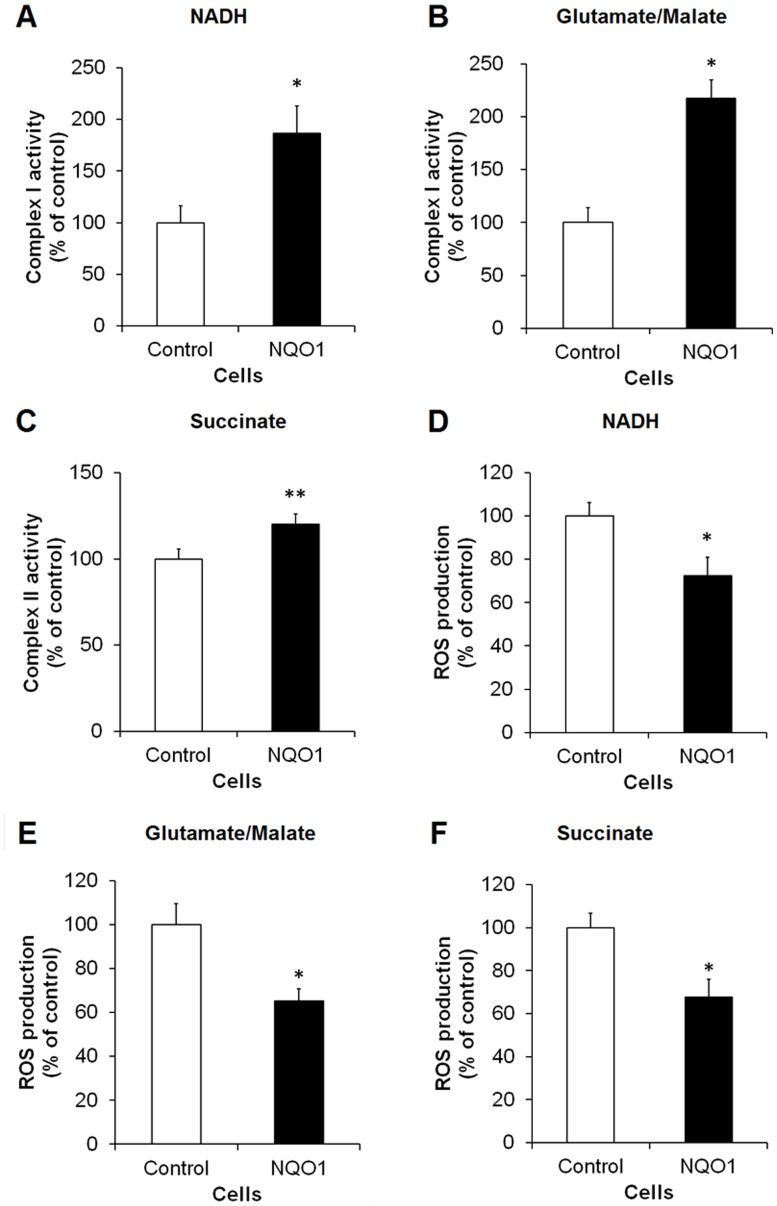
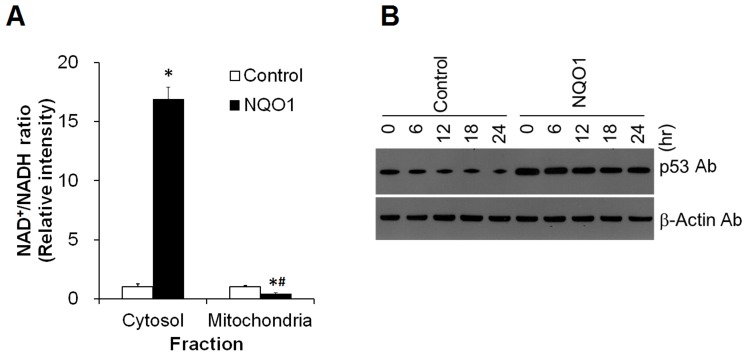
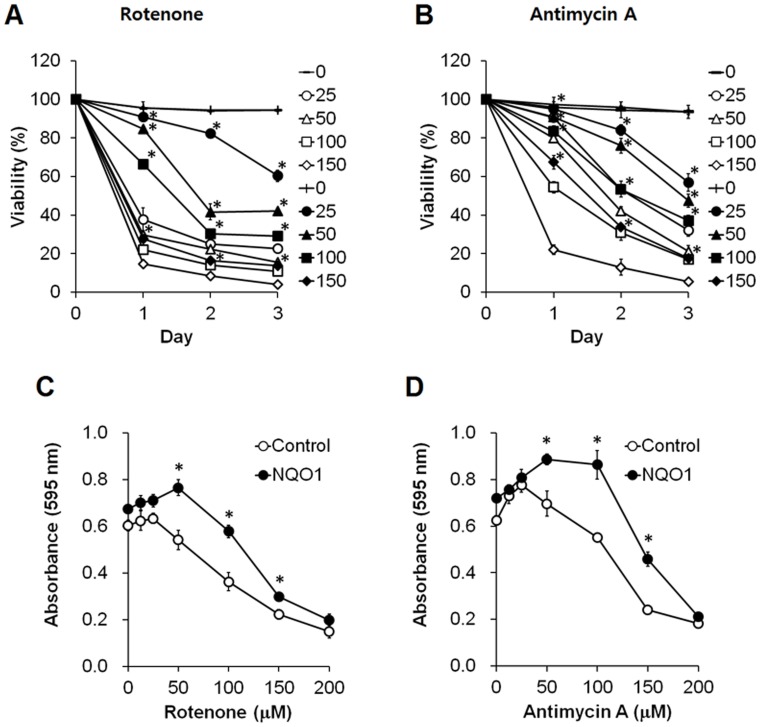
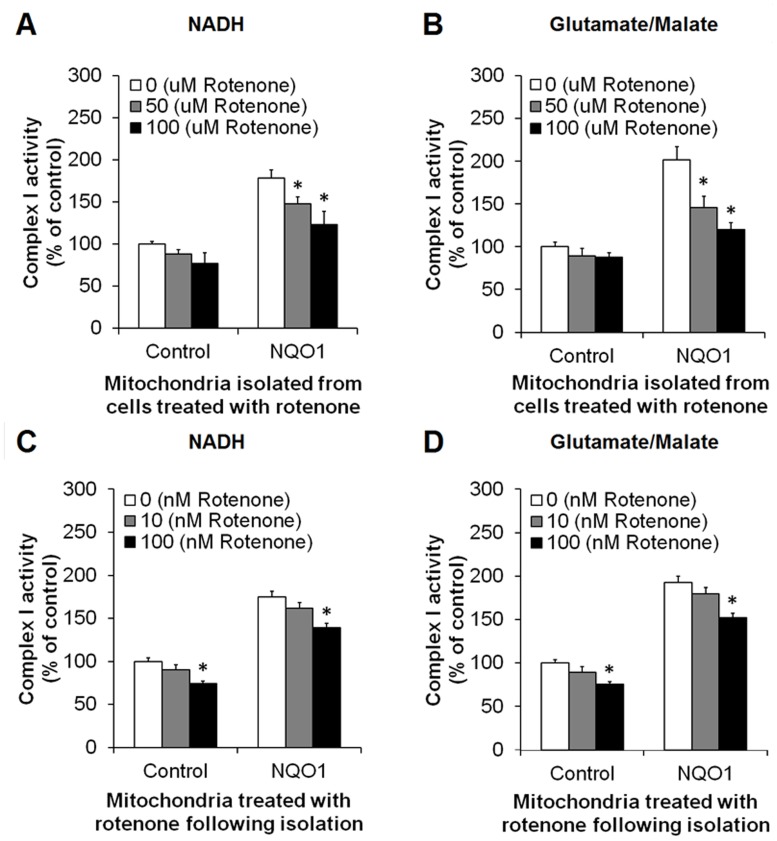
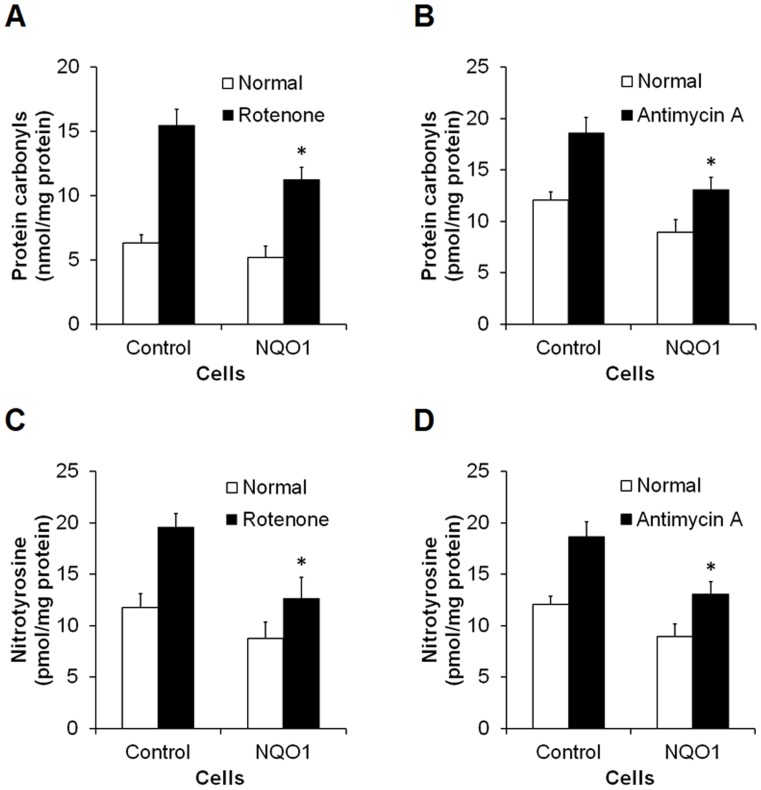
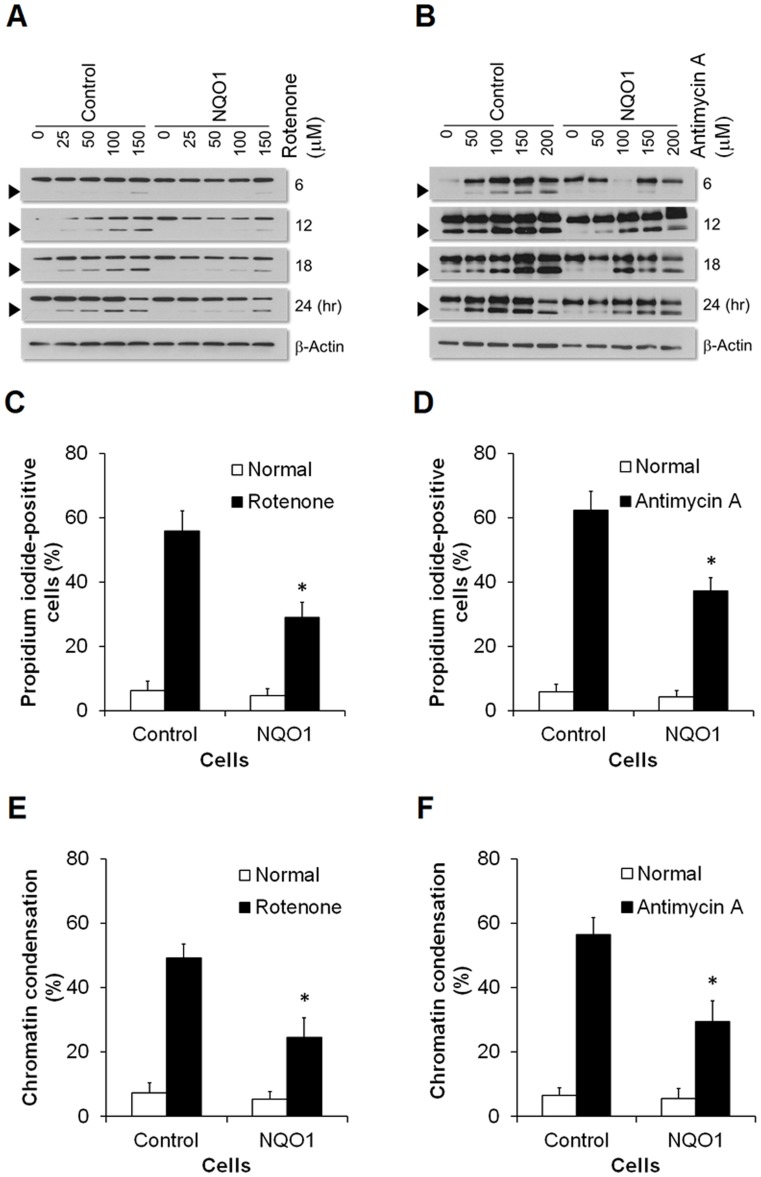
Methods and findings: Here we used human neuroblastoma cells with low or high levels of the PMRS enzyme NADH-quinone oxidoreductase 1 (NQO1) to investigate how the PMRS modulates mitochondrial functions and cell survival. Cells with elevated NQO1 levels exhibited higher levels of oxygen consumption and ATP production, and lower production of reactive oxygen species. Cells overexpressing NQO1 were more resistant to being damaged by the mitochondrial toxins rotenone and antimycin A, and exhibited less oxidative/nitrative damage and less apoptotic cell death. Cells with basal levels of NQO1 resulted in increased oxidative damage to proteins and cellular vulnerability to mitochondrial toxins. Thus, mitochondrial functions are enhanced and oxidative stress is reduced as a result of elevated PMRS activity, enabling cells to maintain redox homeostasis under conditions of metabolic and energetic stress.
Conclusion: These findings suggest that NQO1 is a potential target for the development of therapeutic agents for either preventing neuronal degeneration or promoting the death of neural tumor cells.
Conflict of interest statement
Figures
Similar articles
-
The plasma membrane redox enzyme NQO1 sustains cellular energetics and protects human neuroblastoma cells against metabolic and proteotoxic stress.Age (Dordr). 2012 Apr;34(2):359-70. doi: 10.1007/s11357-011-9245-1. Epub 2011 Apr 13. Age (Dordr). 2012. PMID: 21487704 Free PMC article.
-
Cytochrome b5 reductase, a plasma membrane redox enzyme, protects neuronal cells against metabolic and oxidative stress through maintaining redox state and bioenergetics.Age (Dordr). 2015 Dec;37(6):122. doi: 10.1007/s11357-015-9859-9. Epub 2015 Nov 26. Age (Dordr). 2015. PMID: 26611738 Free PMC article.
-
Cytotoxicity of lipid-soluble ginseng extracts is attenuated by plasma membrane redox enzyme NQO1 through maintaining redox homeostasis and delaying apoptosis in human neuroblastoma cells.Arch Pharm Res. 2016 Oct;39(10):1339-1348. doi: 10.1007/s12272-016-0817-6. Epub 2016 Oct 5. Arch Pharm Res. 2016. PMID: 27704336
-
NAD(P)H:quinone acceptor oxidoreductase 1 (NQO1), a multifunctional antioxidant enzyme and exceptionally versatile cytoprotector.Arch Biochem Biophys. 2010 Sep 1;501(1):116-23. doi: 10.1016/j.abb.2010.03.019. Epub 2010 Mar 31. Arch Biochem Biophys. 2010. PMID: 20361926 Free PMC article. Review.
-
Insights into the New Cancer Therapy through Redox Homeostasis and Metabolic Shifts.Cancers (Basel). 2020 Jul 7;12(7):1822. doi: 10.3390/cancers12071822. Cancers (Basel). 2020. PMID: 32645959 Free PMC article. Review.
Cited by
-
Novel high throughput pooled shRNA screening identifies NQO1 as a potential drug target for host directed therapy for tuberculosis.Sci Rep. 2016 Jun 14;6:27566. doi: 10.1038/srep27566. Sci Rep. 2016. PMID: 27297123 Free PMC article.
-
Mitohormesis in Mice via Sustained Basal Activation of Mitochondrial and Antioxidant Signaling.Cell Metab. 2018 Nov 6;28(5):776-786.e5. doi: 10.1016/j.cmet.2018.07.011. Epub 2018 Aug 16. Cell Metab. 2018. PMID: 30122556 Free PMC article.
-
NRF2: A crucial regulator for mitochondrial metabolic shift and prostate cancer progression.Front Physiol. 2022 Sep 23;13:989793. doi: 10.3389/fphys.2022.989793. eCollection 2022. Front Physiol. 2022. PMID: 36213236 Free PMC article. Review.
-
A New Quinone-Based Inhibitor of Mitochondrial Complex I in D-Conformation, Producing Invasion Reduction and Sensitization to Venetoclax in Breast Cancer Cells.Antioxidants (Basel). 2023 Aug 10;12(8):1597. doi: 10.3390/antiox12081597. Antioxidants (Basel). 2023. PMID: 37627592 Free PMC article.
-
Isothiocyanate from Moringa oleifera seeds mitigates hydrogen peroxide-induced cytotoxicity and preserved morphological features of human neuronal cells.PLoS One. 2018 May 3;13(5):e0196403. doi: 10.1371/journal.pone.0196403. eCollection 2018. PLoS One. 2018. PMID: 29723199 Free PMC article.
References
-
- Luft R, Landau BR (1995) Mitochondrial medicine. J Intern Med 238: 405–421. - PubMed
-
- Lesnefsky EJ, Slabe TJ, Stoll MS, Minkler PE, Hoppel CL (2001) Myocardial ischemia selectively depletes cardiolipin in rabbit heart subsarcolemmal mitochondria. Am J Physiol Heart Circ Physiol 280: H2770–2778. - PubMed
Publication types
MeSH terms
Substances
Grants and funding
LinkOut - more resources
Full Text Sources
Other Literature Sources
Medical
Research Materials
Miscellaneous
