. 2013 Jul 16;8(7):e68335.
doi: 10.1371/journal.pone.0068335. Print 2013.

Comprehensive gene expression profiling reveals synergistic functional networks in cerebral vessels after hypertension or hypercholesterolemia

Affiliations

Comprehensive gene expression profiling reveals synergistic functional networks in cerebral vessels after hypertension or hypercholesterolemia

Wei-Yi Ong et al. PLoS One. .

Abstract

Atherosclerotic stenosis of cerebral arteries or intracranial large artery disease (ICLAD) is a major cause of stroke especially in Asians, Hispanics and Africans, but relatively little is known about gene expression changes in vessels at risk. This study compares comprehensive gene expression profiles in the middle cerebral artery (MCA) of New Zealand White rabbits exposed to two stroke risk factors i.e. hypertension and/or hypercholesterolemia, by the 2-Kidney-1-Clip method, or dietary supplementation with cholesterol. Microarray and Ingenuity Pathway Analyses of the MCA of the hypertensive rabbits showed up-regulated genes in networks containing the node molecules: UBC (ubiquitin), P38 MAPK, ERK, NFkB, SERPINB2, MMP1 and APP (amyloid precursor protein); and down-regulated genes related to MAPK, ERK 1/2, Akt, 26 s proteasome, histone H3 and UBC. The MCA of hypercholesterolemic rabbits showed differentially expressed genes that are surprisingly, linked to almost the same node molecules as the hypertensive rabbits, despite a relatively low percentage of 'common genes' (21 and 7%) between the two conditions. Up-regulated common genes were related to: UBC, SERPINB2, TNF, HNF4A (hepatocyte nuclear factor 4A) and APP, and down-regulated genes, related to UBC. Increased HNF4A message and protein were verified in the aorta. Together, these findings reveal similar nodal molecules and gene pathways in cerebral vessels affected by hypertension or hypercholesterolemia, which could be a basis for synergistic action of risk factors in the pathogenesis of ICLAD.


Conflict of interest statement

Competing Interests: The authors have declared that no competing interests exist.

Figures

Figure 1
Figure 1. Mean arterial pressure and serum cholesterol levels in rabbits.
(A) Mean arterial pressure in hypertension only rabbits. (B) Serum cholesterol levels in hypertension only rabbits. (C) Mean arterial pressure in hypercholesterolemia plus sham- and hypertension plus hypercholesterolemia rabbits. (D) Serum cholesterol levels in hypercholesterolemia plus sham- and hypertension plus hypercholesterolemia rabbits. H: Hypertension only. HC: Hypercholesterolesterolemia plus sham operation. HTHC: Hypertension plus hypercholesterolemia. MAP: mean arterial pressure. Data are expressed as mean ± SEM. *p<0.05, **p<0.01 vs. control (Student’s t-test in A,B; repeated measure ANOVA followed by Tukey test in C,D).
Figure 2
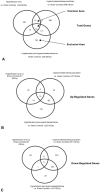
Figure 2. Venn diagram of DEGs in the MCA of hypertension only rabbits; hypercholesterolemia plus sham operated rabbits; and hypertension plus hypercholesterolemia rabbits; all vs. sham operated control rabbits.
A: total number of genes, B: up-regulated genes C: down-regulated genes (One gene which is common between the Hypertension only- and Hypertension plus hypercholesterolemia group was both up- and down-regulated, and omitted).
Figure 3
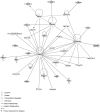
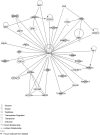
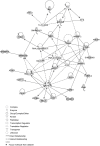
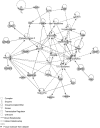
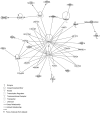
Figure 3. IPA network showing the network with the largest number of up-regulated focus genes in the MCA of the hypertension only group, compared with sham operated controls.
Nodes are displayed using various shapes that represent functional classes of gene products. Focus genes in this network are indicated in grey nodes. Solid and dotted lines indicate direct and indirect interactions, respectively.
Figure 4
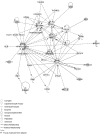
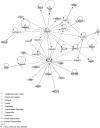
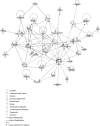
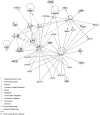
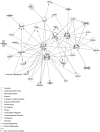
Figure 4. IPA network showing the network with the second largest number of up-regulated focus genes in the hypertension only group, compared with sham operated controls.
Figure 5
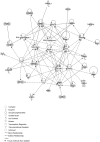
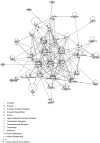
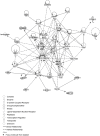
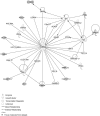
Figure 5. IPA network showing the network with the largest number of down-regulated focus genes in the hypertension only group, compared with sham operated controls.
Figure 6
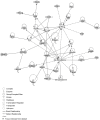
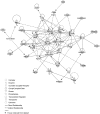
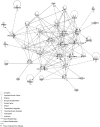
Figure 6. IPA network showing the network with the second largest number of down-regulated focus genes in the hypertension only group, compared with sham operated controls.
Figure 7
Figure 7. IPA network showing the network with the largest number of up-regulated focus genes in the hypercholesterolemia plus sham group, compared with sham operated controls.
Figure 8
Figure 8. IPA network showing the network with the second largest number of up-regulated focus genes in the hypercholesterolemia plus sham group, compared with sham operated controls.
Figure 9
Figure 9. IPA network showing the network with the largest number of down-regulated focus genes in the hypercholesterolemia plus sham group, compared with sham operated controls.
Figure 10
Figure 10. IPA network showing the network with the second largest number of down-regulated focus genes in the hypercholesterolemia plus sham group, compared with sham operated controls.
Figure 11
Figure 11. IPA network showing the network with the largest number of up-regulated focus genes in the hypertension plus hypercholesterolemia group, compared with sham operated controls.
Figure 12
Figure 12. IPA network showing the network with the second largest number of up-regulated focus genes in the hypertension plus hypercholesterolemia group, compared with sham operated controls.
Figure 13
Figure 13. IPA network showing the network with the largest number of down-regulated focus genes in the hypertension plus hypercholesterolemia group, compared with sham operated controls.
Figure 14
Figure 14. IPA network showing the network with the second largest number of down-regulated focus genes in the hypertension plus hypercholesterolemia group, compared with sham operated controls.
Figure 15
Figure 15. IPA network showing the network with the largest number of up-regulated focus genes in the common area between the hypertension only and hypercholesterolemia plus sham group, compared with sham operated controls.
Figure 16
Figure 16. IPA network showing the network with the largest number of down-regulated focus genes in the common area between the hypertension only and hypercholesterolemia plus sham group, compared with sham operated controls.
Figure 17
Figure 17. IPA network showing the network with the largest number of up-regulated focus genes in the hypertension plus hypercholesterolemia group (exclusive area), compared with sham operated controls.
Figure 18
Figure 18. IPA network showing the network with the second largest number of up-regulated focus genes in the hypertension plus hypercholesterolemia group (exclusive area), compared with sham operated controls.
Figure 19
Figure 19. IPA network showing the network with the largest number of down-regulated focus genes in the hypertension plus hypercholesterolemia group (exclusive area), compared with sham operated controls.
Figure 20
Figure 20. IPA network showing the network with the second largest number of down-regulated focus genes in the hypertension plus hypercholesterolemia group (exclusive area), compared with sham group.
Figure 21
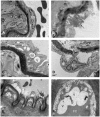
Figure 21. Electron micrographs of the MCA.
(A) Sham operated rabbit on a normal diet showing continuous endothelial cells (EC) (B) Hypertension only rabbit, showing a pyknotic cell (arrow) in the endothelial layer (EC). (C) Hypercholesterolemia plus sham rabbit, showing large intracellular vacuoles (V) in endothelial cells. (D) Hypertension plus hypercholesterolemia rabbit, showing breaks in the basement membrane (BR), and a large extracellular space (S) between the basement membrane and the underlying smooth muscle cells. (E) Hypertension plus hypercholesterolemia rabbit, showing a pyknotic cell among the endothelial layer (arrow), and presence subendothelial foam cells (FC). (F) Higher magnification of a foam cell in E, showing intracellular vacuoles, and extracellular spaces (S) containing collagen fibrils. Scale: A = 1 µm, B–D = 0.5 µm, E = 2 µm, F = 0.2 µm.
Figure 22
Figure 22. HNF4A expression in the aorta.
(A) Real-time RT-PCR analyses of HNF4A in the aorta of control, hypercholesterolemia plus sham, and hypertension plus hypercholesterolemia rabbits. The mean and standard error are shown. *p<0.05 vs. controls by one-way ANOVA with Bonferroni’s multiple comparison post-hoc test (n = 4 in each group). (B) Western blot analyses of HNF4A in the aorta of control, hypercholesterolemia plus sham and hypertension plus hypercholesterolemia rabbits. (C) Densitometric analyses of HNF4A protein, normalized to ß-actin. The mean and standard error are shown. *p<0.05 vs. control by one-way ANOVA with Bonferroni’s multiple comparison post-hoc test (n = 3 in each group). Abbreviations as in Fig. 1.
Figure 23
Figure 23. Histochemical and immunohistochemical staining of the aorta from rabbits exposed to stroke risk factors.
A, D, G: Rabbits on normal diet. B, E, H: Hypercholesterolemia plus sham group. C, F, I: Hypertension plus hypercholesterolemia group. A-C: Aorta of rabbits stained by Masson’s Trichrome. Increased thickness of the neointima (NI) is seen in the hypercholesterolemia plus sham group (B, arrow). The changes are exacerbated in the hypertension plus hypercholesterolemia group (C, arrow). SM = smooth muscle cells in the neointima. D, E, F: Aorta of rabbits immunostained with a mouse monoclonal antibody to HNF-4A. Very little or no labeling is present in normal rabbits, but dense staining is observed in endothelial cells in the hypercholesterolemia plus sham, and hypertension plus hypercholesterolemia rabbits (arrows). G, H,I: Higher magnification of the aorta of rabbits immunostained with mouse monoclonal antibody to HNF-4A, showing dense staining in endothelial cells of hypercholesterolemia plus sham, and hypertension plus hypercholesterolemia rabbits (arrows). Scale: A-F = 200 µm, G-I = 70 µm.

Similar articles

Cited by

References

    1. Wong LK (2006) Global burden of intracranial atherosclerosis. Int J Stroke 1: 158–159. - PubMed
    1. Gorelick PB, Wong KS, Bae HJ, Pandey DK (2008) Large artery intracranial occlusive disease: a large worldwide burden but a relatively neglected frontier. Stroke 39: 2396–2399. - PubMed
    1. Wong KS, Li H (2003) Long-term mortality and recurrent stroke risk among Chinese stroke patients with predominant intracranial atherosclerosis. Stroke 34: 2361–2366. - PubMed
    1. Mazighi M, Tanasescu R, Ducrocq X, Vicaut E, Bracard S, et al. (2006) Prospective study of symptomatic atherothrombotic intracranial stenoses: the GESICA study. Neurology 66: 1187–1191. - PubMed
    1. De Silva DA, Ancalan M, Doshi K, Chang HM, Wong MC, et al. (2009) Intracranial large artery disease in Alzheimer’s disease and vascular dementia among ethnic Asians. Eur J Neurol 16: 643–645. - PubMed

Publication types

Grants and funding

This research was supported by the National Research Foundation Singapore under its Competitive Research Programme (CRP Award NRF-CRP 3-2008-1). The funders had no role in study design, data collection and analysis, decision to publish, or preparation of the manuscript.