. 2013 Jul 22;2(1):10.
doi: 10.1186/2047-217X-2-10.

Assemblathon 2: evaluating de novo methods of genome assembly in three vertebrate species

Keith R Bradnam  1 Joseph N FassAnton AlexandrovPaul BaranayMichael BechnerInanç BirolSébastien BoisvertJarrod A ChapmanGuillaume ChapuisRayan ChikhiHamidreza ChitsazWen-Chi ChouJacques CorbeilCristian Del FabbroT Roderick DockingRichard DurbinDent EarlScott EmrichPavel FedotovNuno A FonsecaGaneshkumar GanapathyRichard A GibbsSante GnerreElénie GodzaridisSteve GoldsteinMatthias HaimelGiles HallDavid HausslerJoseph B HiattIsaac Y HoJason HowardMartin HuntShaun D JackmanDavid B JaffeErich D JarvisHuaiyang JiangSergey KazakovPaul J KerseyJacob O KitzmanJames R KnightSergey KorenTak-Wah LamDominique LavenierFrançois LavioletteYingrui LiZhenyu LiBinghang LiuYue LiuRuibang LuoIain MaccallumMatthew D MacmanesNicolas MailletSergey MelnikovDelphine NaquinZemin NingThomas D OttoBenedict PatenOctávio S PauloAdam M PhillippyFrancisco Pina-MartinsMichael PlaceDariusz PrzybylskiXiang QinCarson QuFilipe J RibeiroStephen RichardsDaniel S RokhsarJ Graham RubySimone ScalabrinMichael C SchatzDavid C SchwartzAlexey SergushichevTed SharpeTimothy I ShawJay ShendureYujian ShiJared T SimpsonHenry SongFedor TsarevFrancesco VezziRiccardo VicedominiBruno M VieiraJun WangKim C WorleyShuangye YinSiu-Ming YiuJianying YuanGuojie ZhangHao ZhangShiguo ZhouIan F Korf
Affiliations

Assemblathon 2: evaluating de novo methods of genome assembly in three vertebrate species

Keith R Bradnam et al. Gigascience. .

Abstract

Background: The process of generating raw genome sequence data continues to become cheaper, faster, and more accurate. However, assembly of such data into high-quality, finished genome sequences remains challenging. Many genome assembly tools are available, but they differ greatly in terms of their performance (speed, scalability, hardware requirements, acceptance of newer read technologies) and in their final output (composition of assembled sequence). More importantly, it remains largely unclear how to best assess the quality of assembled genome sequences. The Assemblathon competitions are intended to assess current state-of-the-art methods in genome assembly.

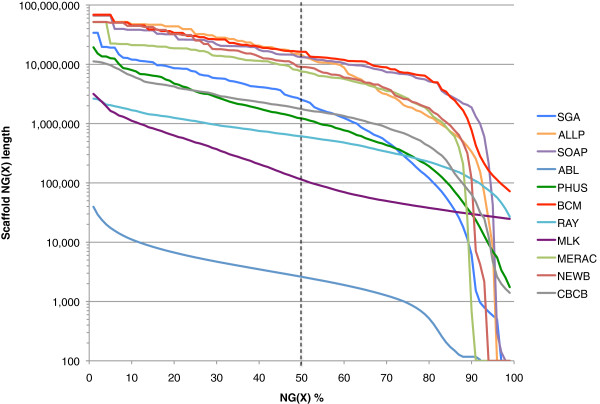
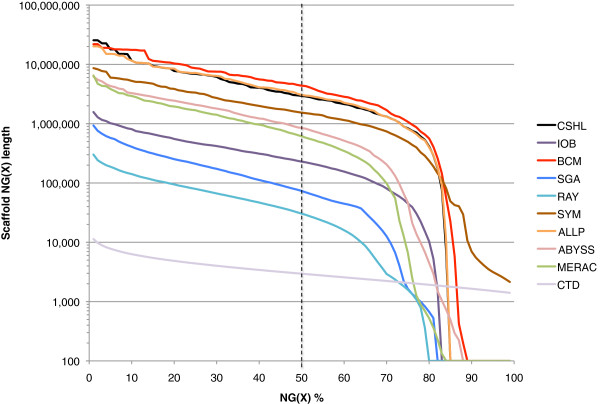
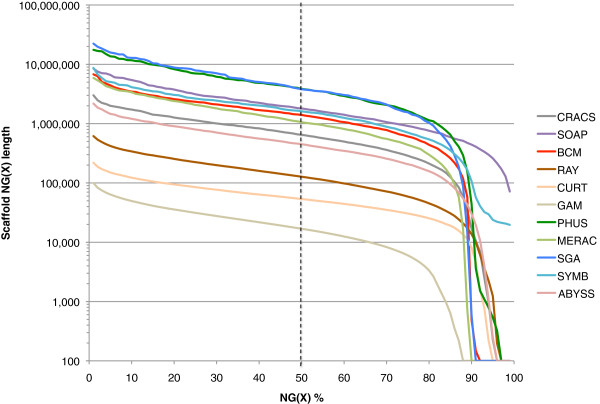
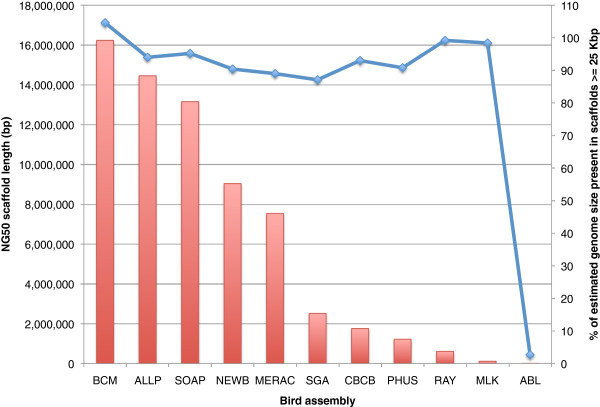
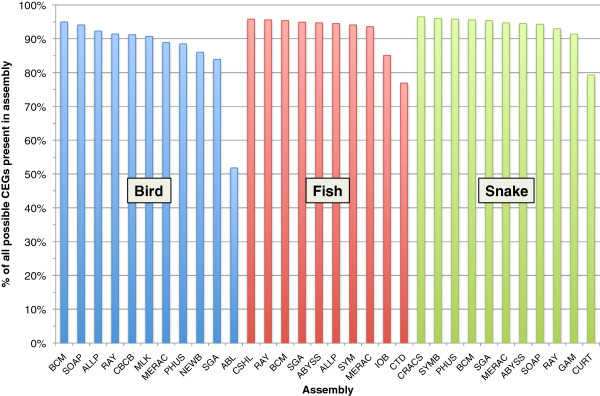
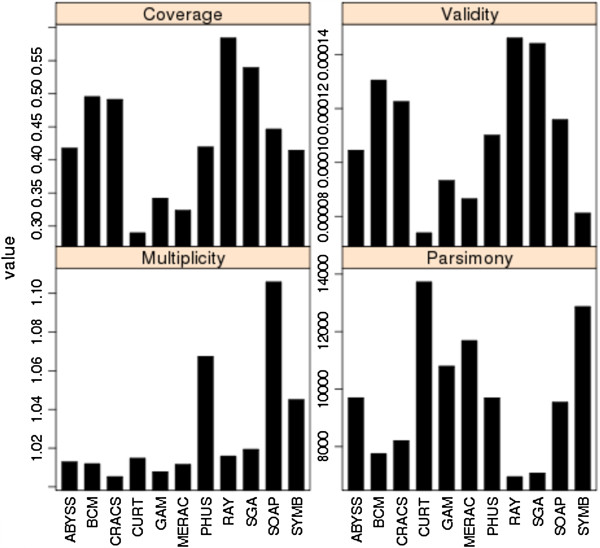
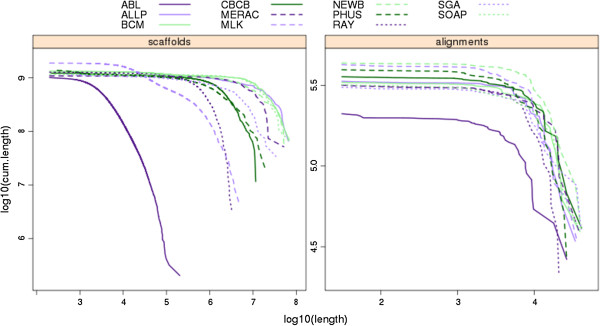
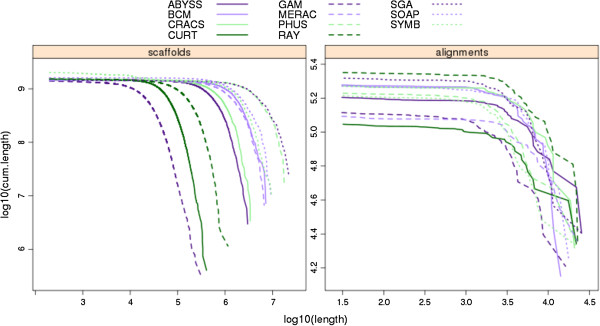
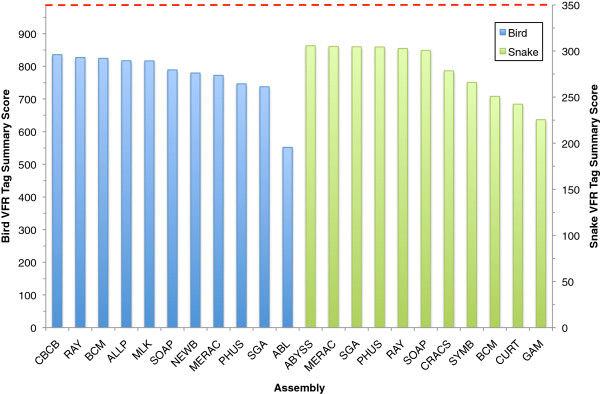
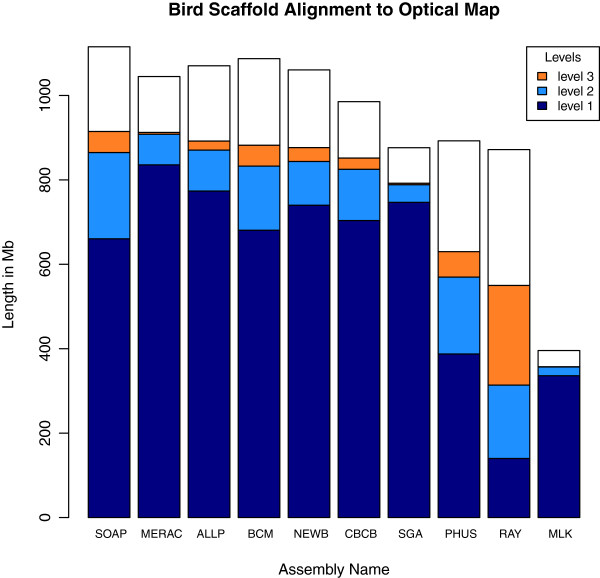
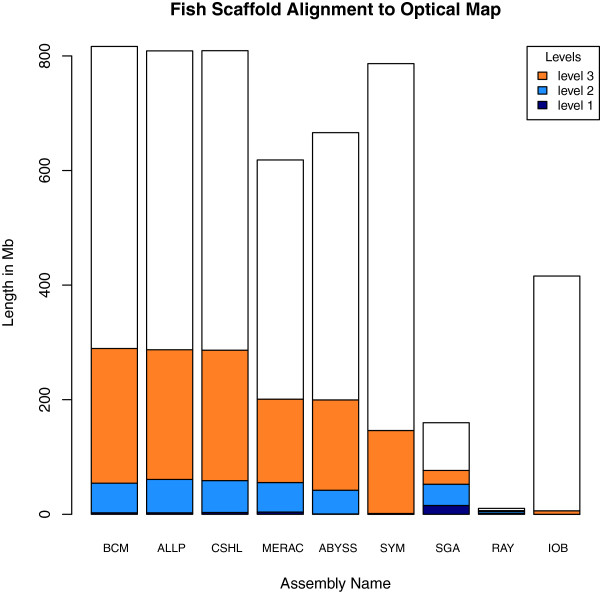
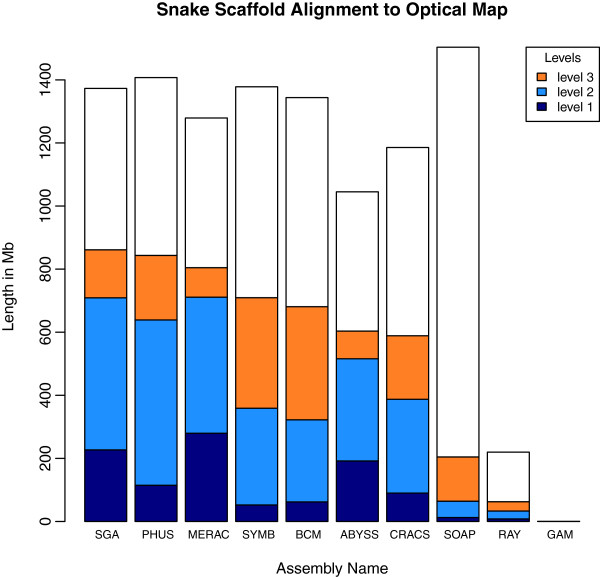
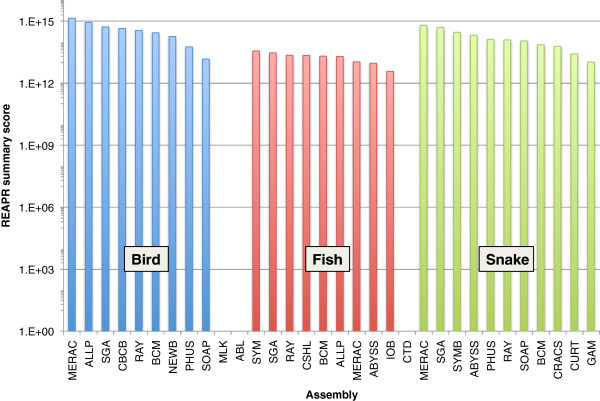
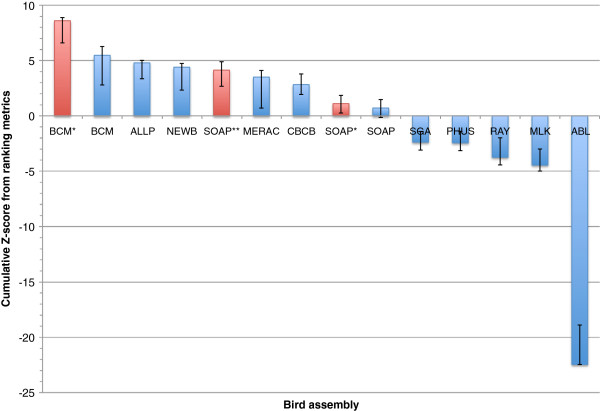
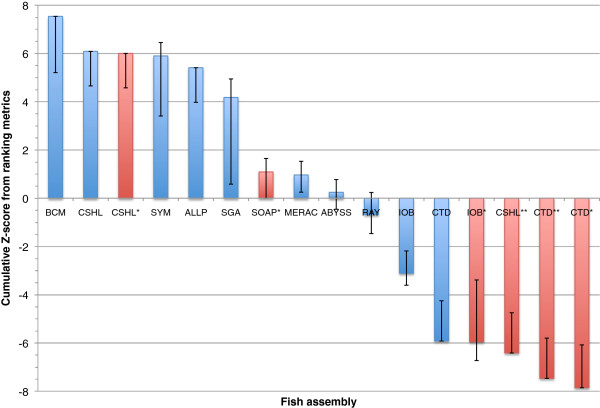
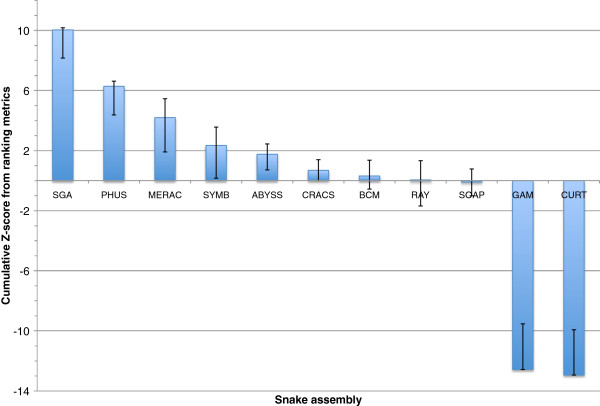
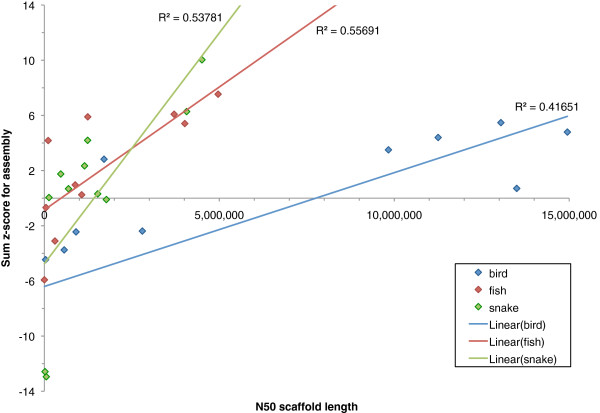
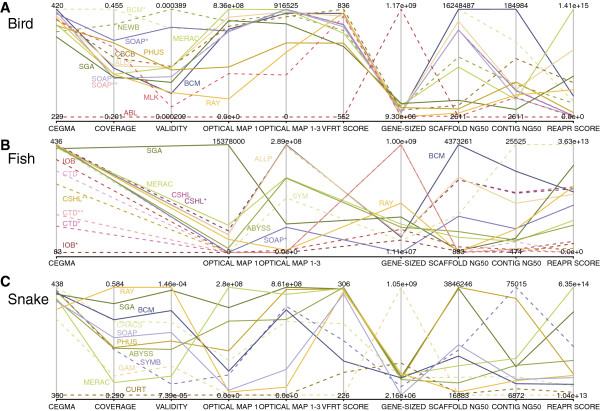
Results: In Assemblathon 2, we provided a variety of sequence data to be assembled for three vertebrate species (a bird, a fish, and snake). This resulted in a total of 43 submitted assemblies from 21 participating teams. We evaluated these assemblies using a combination of optical map data, Fosmid sequences, and several statistical methods. From over 100 different metrics, we chose ten key measures by which to assess the overall quality of the assemblies.

Conclusions: Many current genome assemblers produced useful assemblies, containing a significant representation of their genes and overall genome structure. However, the high degree of variability between the entries suggests that there is still much room for improvement in the field of genome assembly and that approaches which work well in assembling the genome of one species may not necessarily work well for another.


Figures

Figure 1
Figure 1
NG graph showing an overview of bird assembly scaffold lengths. The NG scaffold length (see text) is calculated at integer thresholds (1% to 100%) and the scaffold length (in bp) for that particular threshold is shown on the y-axis. The dotted vertical line indicates the NG50 scaffold length: if all scaffold lengths are summed from longest to the shortest, this is the length at which the sum length accounts for 50% of the estimated genome size. Y-axis is plotted on a log scale. Bird estimated genome size = ~1.2 Gbp.
Figure 2
Figure 2
NG graph showing an overview of fish assembly scaffold lengths. The NG scaffold length (see text) is calculated at integer thresholds (1% to 100%) and the scaffold length (in bp) for that particular threshold is shown on the y-axis. The dotted vertical line indicates the NG50 scaffold length: if all scaffold lengths are summed from longest to the shortest, this is the length at which the sum length accounts for 50% of the estimated genome size. Y-axis is plotted on a log scale. Fish estimated genome size = ~1.6 Gbp.
Figure 3
Figure 3
NG graph showing an overview of snake assembly scaffold lengths. The NG scaffold length (see text) is calculated at integer thresholds (1% to 100%) and the scaffold length (in bp) for that particular threshold is shown on the y-axis. The dotted vertical line indicates the NG50 scaffold length: if all scaffold lengths are summed from longest to the shortest, this is the length at which the sum length accounts for 50% of the estimated genome size. Y-axis is plotted on a log scale. Snake estimated genome size = ~1.0 Gbp.
Figure 4
Figure 4
NG50 scaffold length distribution in bird assemblies and the fraction of the bird genome represented by gene-sized scaffolds. Primary Y-axis (red) shows NG50 scaffold length for bird assemblies: the scaffold length that captures 50% of the estimated genome size (~1.2 Gbp). Secondary Y-axis (blue) shows percentage of estimated genome size that is represented by scaffolds ≥25 Kbp (the average length of a vertebrate gene).
Figure 5
Figure 5
Presence of 458 core eukaryotic genes within assemblies. Number of core eukaryotic genes (CEGs) detected by CEGMA tool that are at least 70% present in individual scaffolds from each assembly as a percentage of total number of CEGs present across all assemblies for each species. Out of a maximum possible 458 CEGs, we found 442, 455, and 454 CEGs across all assemblies of bird (blue), fish (red), and snake (green).
Figure 6
Figure 6
Examples of annotated Fosmid sequences in bird and snake. A) An example bird Fosmid, and B) an example snake Fosmid. ‘Coverage’ track shows depth of read coverage (green = < 1x, red = > 10x, black = everything else); ‘Repeats’ track shows low-complexity and simple repeats (green) and all other repeats (gray). Alignments to assemblies are shown in remaining tracks (one assembly per track). Black bars represent unique alignments to a single scaffold, red bars represent regions of the Fosmid which aligned to multiple scaffolds from that assembly. Unique Fosmid sequence identifiers are included above each coverage track.
Figure 7
Figure 7
Definitions of the COMPASS metrics: Coverage, Validity, Multiplicity, and Parsimony.
Figure 8
Figure 8
COMPASS metrics for bird assemblies. Coverage, Validity, Multiplicity, and Parsimony calculated as in Figure 7.
Figure 9
Figure 9
COMPASS metrics for snake assemblies. Coverage, Validity, Multiplicity, and Parsimony calculated as in Figure 7.
Figure 10
Figure 10
Cumulative length plots of scaffold and alignment lengths for bird assemblies. Alignment lengths are derived from Lastz alignments of scaffold sequences from each assembly to the bird Fosmid sequences. Series were plotted by starting with the longest scaffold/alignment length and subsequently adding lengths of successively shorter scaffolds/alignments to the cumulative length (plotted on y-axis, with log scale).
Figure 11
Figure 11
Cumulative length plots of scaffold and alignment lengths for snake assemblies. Alignment lengths are derived from Lastz alignments of scaffold sequences from each assembly to the snake Fosmid sequences. Series were plotted by starting with the longest scaffold/alignment length and subsequently adding lengths of successively shorter scaffolds/alignments to the cumulative length (plotted on y-axis, with log scale).
Figure 12
Figure 12
Short-range scaffold accuracy assessment via Validated Fosmid Regions. First, validated Fosmid regions (VFRs) were identified (86 in bird and 56 in snake, see text). Then VFRs were divided into non-overlapping 1,000 nt fragments and pairs of 100 nt ‘tags’ were extracted from ends of each fragment and searched (using BLAST) against all scaffolds from each assembly. A summary score for each assembly was calculated as the product of a) the number of pairs of tags that both matched the same scaffold in an assembly (at any distance apart) and b) the percentage of only the uniquely matching tag pairs that matched at the expected distance (± 2 nt). Theoretical maximum scores, which assume that all tag-pairs would map uniquely to a single scaffold, are indicated by red dashed line (988 for bird and 350 for snake).
Figure 13
Figure 13
Optical map results for bird assemblies. Total height of each bar represents total length of scaffolds that were suitable for optical map analysis. Dark blue portions represent ‘level 1 alignments’, sequences that were globally aligned in a restrictive manner. Light blue portions represent ‘level 2 alignments’, sequences that were globally aligned in a permissive manner. Orange portions represent ‘level 3 alignments’, sequences that were locally aligned. Assemblies are ranked in order of the total length of aligned sequence.
Figure 14
Figure 14
Optical map results for fish assemblies. Total height of each bar represents total length of scaffolds that were suitable for optical map analysis. Dark blue portions represent ‘level 1 alignments’, sequences that were globally aligned in a restrictive manner. Light blue portions represent ‘level 2 alignments’, sequences that were globally aligned in a permissive manner. Orange portions represent ‘level 3 alignments’, sequences that were locally aligned. Assemblies are ranked in order of the total length of aligned sequence.
Figure 15
Figure 15
Optical map results for snake assemblies. Total height of each bar represents total length of scaffolds that were suitable for optical map analysis. Dark blue portions represent ‘level 1 alignments’, sequences that were globally aligned in a restrictive manner. Light blue portions represent ‘level 2 alignments’, sequences that were globally aligned in a permissive manner. Orange portions represent ‘level 3 alignments’, sequences that were locally aligned. Assemblies are ranked in order of the total length of aligned sequence. Note: the SOAP assembly is sub-optimal due to use of mistakenly labeled 4 Kbp and 10 Kbp libraries (see Discussion).
Figure 16
Figure 16
REAPR summary scores for all assemblies. This score is calculated as the product of i) the number of error free bases and ii) the squared scaffold N50 length after breaking assemblies at scaffolding errors divided by the original scaffold N50 length. Data shown for assemblies of bird (blue), fish (red), and snake (green). Results for bird assemblies MLK and ABL and fish assembly CTD are not shown as it was not possible to run REAPR on these assemblies (see Methods). REAPR summary score is plotted on a log axis.
Figure 17
Figure 17
Cumulative z-score rankings based on key metrics for all bird assemblies. Standard deviation and mean were calculated for ten chosen metrics, and each assembly was assessed in terms of how many standard deviations they were from the mean. These z-scores were then summed over the different metrics. Positive and negative error bars reflect the best and worst z-score that could be achieved if any one key metric was omitted from the analysis. Assemblies in red represent evaluation entries.
Figure 18
Figure 18
Cumulative z-score rankings based on key metrics for all fish assemblies. Standard deviation and mean were calculated for seven chosen metrics, and each assembly was assessed in terms of how many standard deviations they were from the mean. These z-scores were then summed over the different metrics. Positive and negative error bars reflect the best and worst z-score that could be achieved if any one key metric was omitted from the analysis. Assemblies in red represent evaluation entries.
Figure 19
Figure 19
Cumulative z-score rankings based on key metrics for all snake assemblies. Standard deviation and mean were calculated for ten chosen metrics, and each assembly was assessed in terms of how many standard deviations they were from the mean. These z-scores were then summed over the different metrics. Positive and negative error bars reflect the best and worst z-score that could be achieved if any one key metric was omitted from the analysis. Note: the SOAP assembly is sub-optimal due to use of mistakenly labeled 4 Kbp and 10 Kbp libraries (see Discussion).
Figure 20
Figure 20
Correlation between scaffold N50 length and final z-score ranking. Lines of best fit are added for each series. P-values for correlation coefficients: bird, P = 0.016; fish, P = 0.007; snake, P = 0.005.
Figure 21
Figure 21
Parallel coordinate mosaic plot showing performance of all assemblies in each key metric. Performance of bird, fish, and snake assemblies (panels AC) as assessed across ten key metrics (vertical lines). Scales are indicated by values at the top and bottom of each axis. Each assembly is a colored, labeled line. Dashed lines indicate teams that submitted assemblies for a single species whereas solid lines indicate teams that submitted assemblies for multiple species. Key metrics are CEGMA (number of 458 core eukaryotic genes present); COVERAGE and VALIDITY (of validated Fosmid regions, calculated using COMPASS); OPTICAL MAP 1 and OPTICAL MAP 1–3 (coverage of optical maps at level 1 or at all levels); VFRT SCORE (summary score of validated Fosmid region tag analysis), GENE-SIZED (the amount of an assembly’s scaffolds that are 25 Kbp or longer); SCAFFOLD NG50 and CONTIG NG50 (the lengths of the scaffold or contig that takes the sum length of all scaffolds/contigs past 50% of the estimated genome size); REAPR SCORE (summary score of scaffolds from REAPR tool).

Similar articles

  • De novo likelihood-based measures for comparing genome assemblies.
    Ghodsi M, Hill CM, Astrovskaya I, Lin H, Sommer DD, Koren S, Pop M. Ghodsi M, et al. BMC Res Notes. 2013 Aug 22;6:334. doi: 10.1186/1756-0500-6-334. BMC Res Notes. 2013. PMID: 23965294 Free PMC article.
  • Assemblathon 1: a competitive assessment of de novo short read assembly methods.
    Earl D, Bradnam K, St John J, Darling A, Lin D, Fass J, Yu HO, Buffalo V, Zerbino DR, Diekhans M, Nguyen N, Ariyaratne PN, Sung WK, Ning Z, Haimel M, Simpson JT, Fonseca NA, Birol İ, Docking TR, Ho IY, Rokhsar DS, Chikhi R, Lavenier D, Chapuis G, Naquin D, Maillet N, Schatz MC, Kelley DR, Phillippy AM, Koren S, Yang SP, Wu W, Chou WC, Srivastava A, Shaw TI, Ruby JG, Skewes-Cox P, Betegon M, Dimon MT, Solovyev V, Seledtsov I, Kosarev P, Vorobyev D, Ramirez-Gonzalez R, Leggett R, MacLean D, Xia F, Luo R, Li Z, Xie Y, Liu B, Gnerre S, MacCallum I, Przybylski D, Ribeiro FJ, Yin S, Sharpe T, Hall G, Kersey PJ, Durbin R, Jackman SD, Chapman JA, Huang X, DeRisi JL, Caccamo M, Li Y, Jaffe DB, Green RE, Haussler D, Korf I, Paten B. Earl D, et al. Genome Res. 2011 Dec;21(12):2224-41. doi: 10.1101/gr.126599.111. Epub 2011 Sep 16. Genome Res. 2011. PMID: 21926179 Free PMC article.
  • Fragmentation and Coverage Variation in Viral Metagenome Assemblies, and Their Effect in Diversity Calculations.
    García-López R, Vázquez-Castellanos JF, Moya A. García-López R, et al. Front Bioeng Biotechnol. 2015 Sep 17;3:141. doi: 10.3389/fbioe.2015.00141. eCollection 2015. Front Bioeng Biotechnol. 2015. PMID: 26442255 Free PMC article.
  • Evaluation of genome scaffolding tools using pooled clone sequencing.
    Dal E, Alkan C. Dal E, et al. Turk J Biol. 2018 Dec 10;42(6):471-476. doi: 10.3906/biy-1805-42. eCollection 2018. Turk J Biol. 2018. PMID: 30983868 Free PMC article.
  • Toward a statistically explicit understanding of de novo sequence assembly.
    Howison M, Zapata F, Dunn CW. Howison M, et al. Bioinformatics. 2013 Dec 1;29(23):2959-63. doi: 10.1093/bioinformatics/btt525. Epub 2013 Sep 10. Bioinformatics. 2013. PMID: 24021385 Review.

Cited by

References

    1. Bentley DR. Whole-genome re-sequencing. Curr Opin Genet Dev. 2006;16:545–552. - PubMed
    1. Haussler D, O'Brien SJ, Ryder OA, Barker FK, Clamp M, Crawford AJ, Hanner R, Hanotte O, Johnson WE, McGuire JA. Genome 10K: a proposal to obtain whole-genome sequence for 10 000 vertebrate species. J Hered. 2009;100:659–674. - PMC - PubMed
    1. i5K - ArthropodBase wiki. http://www.arthropodgenomes.org/wiki/i5K.
    1. Kumar S, Schiffer PH, Blaxter M. 959 Nematode Genomes: a semantic wiki for coordinating sequencing projects. Nucleic Acids Res. 2012;40:D1295–D1300. - PMC - PubMed
    1. Pevzner PA, Tang H, Waterman MS. An Eulerian path approach to DNA fragment assembly. Proc Natl Acad Sci. 2001;98:9748–9753. - PMC - PubMed