. 2013 Sep;24(17):2655-67.
doi: 10.1091/mbc.E13-01-0061. Epub 2013 Jul 17.

Rho GTPase-independent regulation of mitotic progression by the RhoGEF Net1

Affiliations

Rho GTPase-independent regulation of mitotic progression by the RhoGEF Net1

Sarita Menon et al. Mol Biol Cell. 2013 Sep.

Abstract

Neuroepithelial transforming gene 1 (Net1) is a RhoA-subfamily-specific guanine nucleotide exchange factor that is overexpressed in multiple human cancers and is required for proliferation. Molecular mechanisms underlying its role in cell proliferation are unknown. Here we show that overexpression or knockdown of Net1 causes mitotic defects. Net1 is required for chromosome congression during metaphase and generation of stable kinetochore microtubule attachments. Accordingly, inhibition of Net1 expression results in spindle assembly checkpoint activation. The ability of Net1 to control mitosis is independent of RhoA or RhoB activation, as knockdown of either GTPase does not phenocopy effects of Net1 knockdown on nuclear morphology, and effects of Net1 knockdown are effectively rescued by expression of catalytically inactive Net1. We also observe that Net1 expression is required for centrosomal activation of p21-activated kinase and its downstream kinase Aurora A, which are critical regulators of centrosome maturation and spindle assembly. These results identify Net1 as a novel regulator of mitosis and indicate that altered expression of Net1, as occurs in human cancers, may adversely affect genomic stability.


Figures

FIGURE 1:
FIGURE 1:
Overexpression of Net1 isoforms causes nuclear morphology defects. (A) HeLa cells were transfected with HA-Net1, HA-Net1A, or HA-Net1ΔN. Two days later the cells were fixed and stained for HA-epitope proteins (green), α-tubulin (red), and DNA (blue). Shown are representative micrographs. Bar, 10 μm. (B) Functional domains in Net1 proteins. DH, Dbl homology domain; PH, pleckstrin homology domain; orange ovals, nuclear localization signal sequences; purple ovals, C-terminal PDZ domain–binding site; blue bar, Net1-specific sequence (amino acids 1–85); green bar, Net1A-specific sequence (amino acids 1–31); numbers refer to amino acids for mouse Net1 proteins. (C) Quantification of defects in nuclear morphology. Average of three independent experiments. Errors are SEM. Statistical significance compared with control values was determined by Student's t test; *p < 0.05; **p < 0.01; ***p < 0.001.
FIGURE 2:
FIGURE 2:
Net1 knockdown results in aberrant nuclear morphology. HeLa cells were transfected with isoform-specific shRNA sequences in plasmids coexpressing either hMGFP or puromycin resistance genes. At 48 or 72 h later cells were fixed for immunofluorescence analysis or collected for real-time qPCR and Western blot analysis. (A) Immunofluorescence images of cells expressing nontargeting control, Net1, Net1A, or Net1/Net1A shRNAs. shRNA-transfected cells expressed hMGFP and were stained for α-tubulin (red) and DNA (blue). Bar, 10 μm. (B) Quantification of aberrant nuclear morphology in shRNA-transfected cells selected with puromycin. Average of at least three independent experiments. Errors are SEM. Statistical significance was determined by Student's t test; *p < 0.05; **p < 0.01; ***p < 0.001. (C) Real-time qPCR analysis of Net1 and Net1A transcript expression. Transcript levels are normalized to GAPDH. Errors are SEM. (D) Representative Western blot analysis of whole-cell lysates from shRNA-transfected cells. Upper band, Net1; lower band, Net1A.
FIGURE 3:
FIGURE 3:
Net1 depletion interferes with mitotic progression. HeLa cells were transfected with control or Net1-specific siRNAs. One day later the cells were retransfected with a plasmid expressing mCherry-H2B. Live cell imaging was performed 2 d after that to monitor mitotic progression. (A) Representative still frames from control siRNA–transfected cells. The time elapsed from nuclear envelope breakdown is shown in the lower right-hand corner (minutes). (B) Mitotic progression in two different Net1 siRNA–transfected cells. Middle, arrows indicate lagging chromosomes. Bar, 10 μm. (C) Quantification of time required to progress through different phases of mitosis in control and Net1 siRNA–transfected cells. Errors are SEM. Statistical significance was determined by Student's t test; **p < 0.01; ***p < 0.001.
FIGURE 4:
FIGURE 4:
Net1 is required for chromosome congression and separation. (A) HeLa cells were transfected with control or Net1 isoform–specific shRNA expression plasmids. Two days later the cells were fixed and stained for the kinetochore antigen CREST (red), α-tubulin (green), and DNA (blue). Transfected cells were visualized by coexpression of enhanced green fluorescent protein (eGFP) from the same plasmid (not shown). Cells were imaged from the top down. Representative micrographs are depicted. Bar, 10 μm. (B) Quantification of chromatin area from three independent experiments. Bars are median values. Statistical significance compared with control values was determined by Student's t test; ***p < 0.001. (C) HeLa cells were transfected with control or Net1 isoform–specific shRNA expression plasmids. Two days later the cells were fixed and stained for CREST (red), α-tubulin (green), and DNA (blue). Transfected cells were visualized by coexpression of eGFP from the same plasmid (not shown). Representative micrographs. Bar, 10 μm. (D) Quantification of anaphase cells with lagging chromosomes. The average from three independent experiments. Errors are SEM. Statistical significance was determined by Student's t test; *p < 0.05; **p < 0.01.
FIGURE 5:
FIGURE 5:
Spindle assembly checkpoint activation and reduced spindle stability in Net1-depleted cells. (A) HeLa cells were transfected with control or Net1-specific siRNAs. Two days later the cells were fixed and stained for the spindle assembly checkpoint proteins BubRI (left, green) or Mad2 (right, green), CREST (red), and DNA (blue). Spindle assembly checkpoint activation was determined by adjacent localization of BubRI or Mad2 with CREST in metaphase cells (insets). Representative micrographs. Bar, 2 μm. (B) Control or Net1 siRNA–transfected cells were incubated at 4°C for 10 min before fixation. The cells were then stained for α-tubulin (green), CREST (red), and DNA (blue). Representative micrographs. Bar, 10 μm. (C) Quantification of unattached kinetochores in control or Net1 siRNA–transfected cells after cold treatment. Average of 25–30 kinetochores counted/cell from three independent experiments. Errors are SEM. Statistical significance was determined by Student's t test; **p < 0.001. (D) Representative Western blot of siRNA-transfected cells.
FIGURE 6:
FIGURE 6:
Depletion of RhoA or RhoB does not phenocopy the effects of Net1 knockdown on nuclear morphology. (A) HeLa cells were transfected with control, RhoA, RhoB, or Net1-specific siRNAs. Two days later the cells were fixed and stained for α-tubulin (green), CREST (red), and DNA (blue). Representative micrographs. Bar, 10 μm. (B) Quantification of aberrant nuclear morphologies in siRNA-transfected cells. Average of three independent experiments. Errors are SEM. Statistical significance compared with control values was determined by Student's t test; *p < 0.05; **p < 0.01. (C) Representative Western blot of siRNA-transfected cells. (D) RhoA activity in asynchronous and prometaphase-arrested cells transfected with control or Net1 specific siRNAs. Average of three independent experiments. Errors are SEM.
FIGURE 7:
FIGURE 7:
Expression of wild-type or catalytically inactive Net1 rescues nuclear morphology in Net1-depleted cells. HeLa cells were transfected with control (A) or Net1-specific (B) siRNAs. One day later the cells were transfected with plasmids expressing siRNA-resistant, HA-epitope-tagged wild-type or catalytically inactive Net1 (L321E). Two days later the cells were fixed and stained for HA-epitope expression (green), α-tubulin (red), CREST (purple), and DNA (blue). Representative micrographs. Bar, 10 μm. (C) Quantification of aberrant nuclear morphology. Average of three independent experiments. Errors are SEM. Statistical significance compared with control values was determined by Student's t test; *p < 0.05; **p < 0.01; ***p < 0.001. (D) Assessment of the activation state of wild-type and catalytically inactive Net1. HeLa cells were transfected with HA-epitope-tagged wild-type Net1 or Net1 L321E. Two days later the cells were lysed and tested for interaction with GST or GST-A17RhoA in pull-down assays. Left, Western blots for HA-Net1 proteins and GST in the glutathione-agarose pull downs. Right, Western blots of HA-Net1 proteins and GAPDH in cell lysates. A representative experiment from three independent experiments. (E) Quantification of Net1 activity assays. Statistical significance was determined by Student's t test; ***p < 0.001.
FIGURE 8:
FIGURE 8:
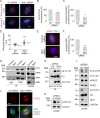
Net1 knockdown inhibits Aurora A and Pak activation at centrosomes. (A) HeLa cells were transfected with control or Net1 siRNAs, fixed 72 h later, and stained for total Aurora A or phospho–threonine 288-Aurora A (red) and DNA (blue). Bar, 5 μm. (B) Quantification of total Aurora A or (C) phospho–Aurora A at the centrosome. Graphs represent average values from three independent experiments. Errors are SEM. Statistical significance was determined by Student's t test; *p < 0.05. (D) Distance between spindle poles in metaphase cells that were transfected with control or Net1 siRNAs. Values are from three independent experiments. Bars, median values. Statistical significance was determined by Student's t test; ***p < 0.001. (E) HeLa cells were transfected with control or Net1-specific siRNAs and then fixed and stained for phospho–T402-PAK (red) and DNA (blue). Bar, 5 μm. (F) Quantification of the phospho-Pak signal at the centrosome. Average of three independent experiments. Errors are SEM. Statistical significance was determined by Student's t test; **p < 0.01. (G) HeLa cells transfected with control and Net1 siRNAs were synchronized in prometaphase with nocodazole. Mitotic cells were collected by shake-off, and cell extracts were immunoprecipitated with control (IgG) or anti-PAK antibodies. Immunoprecipitates and total lysates were tested for the presence of GIT1, βPIX, PAK2, and Net1 by Western blotting. A representative experiment from three independent experiments. (H) Mitotic control or Net1 siRNA-transfected cells were collected as in G, and cell lysates were subject to immunoprecipitation with control IgG or Aurora A antibody. After washing, Aurora A kinase activity toward histone H3 serine 10 was assessed in vitro and visualized by Western blotting. A representative experiment from three independent experiments. (I) Mitotic control and Net1 siRNA–transfected cells were collected as in G, and cell lysates were tested by Western blotting with the indicated antibodies. A representative experiment from three independent experiments. (J) Control and Net1 siRNA–transfected cells were stained for TACC3 (red), α-tubulin (green), and DNA (blue). Bar, 5 μm. Representative maximum intensity z-planes from three independent experiments. (K) Western blot for phosphorylated (pTACC3) and total TACC3 from control and Net1 siRNA–transfected cells. A representative experiment from three independent experiments.

Similar articles

Cited by

References

    1. Alberts AS, Qin H, Carr HS, Frost JA. PAK1 negatively regulates the activity of the Rho exchange factor NET1. J Biol Chem. 2005;280:12152–12161. - PubMed
    1. Alberts AS, Treisman R. Activation of RhoA and SAPK/JNK signalling pathways by the RhoA-specific exchange factor mNET1. EMBO J. 1998;17:4075–4085. - PMC - PubMed
    1. Aoki T, Ueda S, Kataoka T, Satoh T. Regulation of mitotic spindle formation by the RhoA guanine nucleotide exchange factor ARHGEF10. BMC Cell Biol. 2009;10:56. - PMC - PubMed
    1. Asiedu M, Wu D, Matsumura F, Wei Q. Centrosome/spindle pole-associated protein regulates cytokinesis via promoting the recruitment of MyoGEF to the central spindle. Mol Biol Cell. 2009;20:1428–1440. - PMC - PubMed
    1. Bakal CJ, Finan D, LaRose J, Wells CD, Gish G, Kulkarni S, DeSepulveda P, Wilde A, Rottapel R. The Rho GTP exchange factor Lfc promotes spindle assembly in early mitosis. Proc Natl Acad Sci USA. 2005;102:9529–9534. - PMC - PubMed

Publication types

LinkOut - more resources