Structural studies of p53 inactivation by DNA-contact mutations and its rescue by suppressor mutations via alternative protein-DNA interactions
- PMID: 23863845
- PMCID: PMC3794590
- DOI: 10.1093/nar/gkt630
Structural studies of p53 inactivation by DNA-contact mutations and its rescue by suppressor mutations via alternative protein-DNA interactions
Abstract
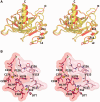
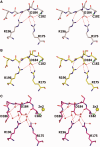
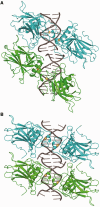
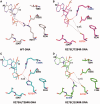
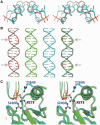
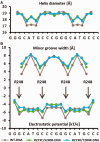
A p53 hot-spot mutation found frequently in human cancer is the replacement of R273 by histidine or cysteine residues resulting in p53 loss of function as a tumor suppressor. These mutants can be reactivated by the incorporation of second-site suppressor mutations. Here, we present high-resolution crystal structures of the p53 core domains of the cancer-related proteins, the rescued proteins and their complexes with DNA. The structures show that inactivation of p53 results from the incapacity of the mutated residues to form stabilizing interactions with the DNA backbone, and that reactivation is achieved through alternative interactions formed by the suppressor mutations. Detailed structural and computational analysis demonstrates that the rescued p53 complexes are not fully restored in terms of DNA structure and its interface with p53. Contrary to our previously studied wild-type (wt) p53-DNA complexes showing non-canonical Hoogsteen A/T base pairs of the DNA helix that lead to local minor-groove narrowing and enhanced electrostatic interactions with p53, the current structures display Watson-Crick base pairs associated with direct or water-mediated hydrogen bonds with p53 at the minor groove. These findings highlight the pivotal role played by R273 residues in supporting the unique geometry of the DNA target and its sequence-specific complex with p53.
Figures


Similar articles
-
Structural basis of restoring sequence-specific DNA binding and transactivation to mutant p53 by suppressor mutations.J Mol Biol. 2009 Jan 9;385(1):249-65. doi: 10.1016/j.jmb.2008.10.063. Epub 2008 Oct 30. J Mol Biol. 2009. PMID: 18996393
-
Structures of oncogenic, suppressor and rescued p53 core-domain variants: mechanisms of mutant p53 rescue.Acta Crystallogr D Biol Crystallogr. 2013 Oct;69(Pt 10):2146-56. doi: 10.1107/S0907444913020830. Epub 2013 Sep 20. Acta Crystallogr D Biol Crystallogr. 2013. PMID: 24100332 Free PMC article.
-
Factors governing loss and rescue of DNA binding upon single and double mutations in the p53 core domain.Nucleic Acids Res. 2002 Apr 1;30(7):1563-74. doi: 10.1093/nar/30.7.1563. Nucleic Acids Res. 2002. PMID: 11917017 Free PMC article.
-
Structural biology of the tumor suppressor p53 and cancer-associated mutants.Adv Cancer Res. 2007;97:1-23. doi: 10.1016/S0065-230X(06)97001-8. Adv Cancer Res. 2007. PMID: 17419939 Review.
-
Structure-function-rescue: the diverse nature of common p53 cancer mutants.Oncogene. 2007 Apr 2;26(15):2226-42. doi: 10.1038/sj.onc.1210291. Oncogene. 2007. PMID: 17401432 Review.
Cited by
-
Structure and Function of p53-DNA Complexes with Inactivation and Rescue Mutations: A Molecular Dynamics Simulation Study.PLoS One. 2015 Aug 5;10(8):e0134638. doi: 10.1371/journal.pone.0134638. eCollection 2015. PLoS One. 2015. PMID: 26244575 Free PMC article.
-
Targeting p53 pathways: mechanisms, structures, and advances in therapy.Signal Transduct Target Ther. 2023 Mar 1;8(1):92. doi: 10.1038/s41392-023-01347-1. Signal Transduct Target Ther. 2023. PMID: 36859359 Free PMC article. Review.
-
Combining Ramachandran plot and molecular dynamics simulation for structural-based variant classification: Using TP53 variants as model.Comput Struct Biotechnol J. 2020 Dec 2;18:4033-4039. doi: 10.1016/j.csbj.2020.11.041. eCollection 2020. Comput Struct Biotechnol J. 2020. PMID: 33363700 Free PMC article.
-
Intracellular pH Regulates Cancer and Stem Cell Behaviors: A Protein Dynamics Perspective.Front Oncol. 2020 Aug 26;10:1401. doi: 10.3389/fonc.2020.01401. eCollection 2020. Front Oncol. 2020. PMID: 32983969 Free PMC article. Review.
-
Computational study of missense mutations in phenylalanine hydroxylase.J Mol Model. 2015 Apr;21(4):70. doi: 10.1007/s00894-015-2620-6. Epub 2015 Mar 7. J Mol Model. 2015. PMID: 25750018
References
-
- Vogelstein B, Lane D, Levine AJ. Surfing the p53 network. Nature. 2000;408:307–310. - PubMed
-
- Oren M. Decision making by p53: life, death and cancer. Cell Death Differ. 2003;10:431–442. - PubMed
-
- Harris SL, Levine AJ. The p53 pathway: positive and negative feedback loops. Oncogene. 2005;24:2899–2908. - PubMed
-
- El-Deiry WS, Kern SE, Pietenpol JA, Kinzler KW, Vogelstein B. Definition of a consensus binding site for p53. Nat. Gen. 1992;1:45–49. - PubMed
Publication types
MeSH terms
Substances
Associated data
- Actions
- Actions
- Actions
- Actions
- Actions
- Actions
- Actions
- Actions
- Actions
LinkOut - more resources
Full Text Sources
Other Literature Sources
Research Materials
Miscellaneous

