. 2013 Sep;41(17):8220-36.
doi: 10.1093/nar/gkt596. Epub 2013 Jul 11.

Widespread purifying selection on RNA structure in mammals

Affiliations

Widespread purifying selection on RNA structure in mammals

Martin A Smith et al. Nucleic Acids Res. 2013 Sep.

Abstract

Evolutionarily conserved RNA secondary structures are a robust indicator of purifying selection and, consequently, molecular function. Evaluating their genome-wide occurrence through comparative genomics has consistently been plagued by high false-positive rates and divergent predictions. We present a novel benchmarking pipeline aimed at calibrating the precision of genome-wide scans for consensus RNA structure prediction. The benchmarking data obtained from two refined structure prediction algorithms, RNAz and SISSIz, were then analyzed to fine-tune the parameters of an optimized workflow for genomic sliding window screens. When applied to consistency-based multiple genome alignments of 35 mammals, our approach confidently identifies >4 million evolutionarily constrained RNA structures using a conservative sensitivity threshold that entails historically low false discovery rates for such analyses (5-22%). These predictions comprise 13.6% of the human genome, 88% of which fall outside any known sequence-constrained element, suggesting that a large proportion of the mammalian genome is functional. As an example, our findings identify both known and novel conserved RNA structure motifs in the long noncoding RNA MALAT1. This study provides an extensive set of functional transcriptomic annotations that will assist researchers in uncovering the precise mechanisms underlying the developmental ontologies of higher eukaryotes.


Figures

Figure 1.
Figure 1.
Benchmarking the sensitivity of sliding-window RNA structure prediction. (A) Benchmarking pipeline for simulating the experimental conditions of sliding-window methodologies using known RNA structure alignments. (B) The relative sensitivities of conserved RNA secondary structure prediction algorithms are plotted for randomly sampled, native RFAM subalignments in function of the amount of sequences, window length and MPI. Opaque bars represent high-confidence predictions (RNAz probability ≥ 0.9, SISSIz Z-score ≤ −4), while translucent bars represent lower-confidence predictions (RNAz probability ≥ 0.5, SISSIz Z-score ≤ −2). Each bar represents the outcome of 200 sampled alignments with RNAz version 2.0 (using options ‘-f–d–l’), SISSIz using default parameters and SISSIz with RIBOSUM scoring (option ‘-j’) for all indicated window sizes, sequence depths and MPI ranges. The latter are indicated by their bounded values on the x-axis.
Figure 2.
Figure 2.
Comparative performance of consensus-based ECS algorithms. (A) Proportion of correctly predicted RFAM base pairs for each algorithm in function of the window size, for high-confidence predictions (RNAz probability ≥ 0.9, SISSIz Z-score ≤ −4). Error bars indicate the 95% confidence interval. (B) Arithmetic mean of the ratio of annotated RFAM base pairs in subalignments harboring high-confidence predictions versus that which fail to produce high-confidence predictions. Error bars indicate the standard error. (C) Relative exclusive overlap between RNAz and both variants of SISSIz. Values represent the percentage of total sampled alignments that produce high-confidence predictions by either algorithm. (D) Average runtimes per sample of the different tested algorithms in function of the sampled alignment length on a 2.66 GHz processor. Error bars represent the standard error.
Figure 3.
Figure 3.
Sequence characteristics of high-confidence predictions for human chromosome 10. The kernel density estimates of the distribution of sampled species, MPI and G + C content are contrasted for all queried alignments and each subset of high-confidence hits (RNAz SVM RNA-class probability ≥ 90%; SISSIz Z-score ≤ −4). The genomic background consists of all sampled alignments.
Figure 4.
Figure 4.
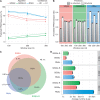
Genomic coverage and distribution of ECS predictions. (A) Size distribution of predicted ECS clusters. (B) Genomic distribution of ECS predictions with respect to the comprehensive GENCODE (version 14) genome annotations (51). Intergenic regions are defined as nonintronic or exonic regions. (C) Enrichment of ECS predictions in specific genomic features. The odds ratios are calculated as the ratio of ECS:nonECS base coverage in the specified genomic features compared with that outside said features, as defined by GENCODE annotations (version 14). UTR+ regions correspond to annotated untranslated regions with 250 and 2500 additional nucleotides flanking the 5′- and 3′-ends, respectively. (D) Venn diagram of the inclusive overlap between ECS predictions and known sequence-constrained elements. SiPhy-merged corresponds to the combined SiPhy-ω and SiPhy-π sets from (52). Mammalian PhastCons elements were extracted from the UCSC genome browser (hg19). GERP++ elements for 35 eutherian mammals were downloaded from Ensembl (release 65). Both SiPhy and PhastCons elements are derived from Multiz alignments, whereas ECS and Gerp++ are derived from EPO alignments of 35 eutherian mammals. (E) Fraction of predictions from previous screens that partially overlap the ECSs from SISSIz and RNAz disclosed in this study. CMfinder (version 0.2)-predicted RNA structures are taken from the ENCODE pilot project data (18), which surveyed Multiz alignments of 16 vertebrates. EvoFold (version 2.0) predictions stem from the mammalian portion of Multiz 41 vertebrate alignments (53). RNAz (version 1.0) predictions stem from Multiz alignments of eight vertebrates as reported in (19). Intersections were performed with bedTools (54). (F) Detection of known and putative functional RNAs: microRNAs from miRBase 15 (55); small nucleolar RNAs and small Cajal body-specfic RNAs from snoRNABase 3 (56); transfer RNAs from tRNAscan-SE 1.23 (57); large intergenic ncRNAs from the Human Body Map (58); EvoFam ECS predictions (and paralogs) from 29 mammals (53); other RNAs corresponding to a comprehensive set of structural RNA annotations (http://moma.ki.au.dk/prj/mammals/). The red line indicates the observed genomic background coverage (13.6%) by ECSs reported in this manuscript.
Figure 5.
Figure 5.
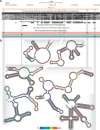
Structural characterization of the long ncRNA MALAT1. (A) UCSC genome browser (hg19) screenshot of the MALAT1 locus with the following tracks: EPO multiple genome alignment (used to emit predictions), GERP++ constrained sequence element track, repeat elements, EvoFold evolutionarily conserved RNA secondary structure predictions, and the ECS predictions reported herein, with colors representing the algorithm used to make the prediction (SISSIz in red, SISSIz with RIBOSUM in green, RNAz in blue). Red rectangles represent ECS predictions that are structurally congruent with the reference sequence. (B) Human RNA secondary structures associated to predictions. Consensus RNA secondary structures were extracted from the associated alignments and used as a constraint for folding the human sequence with RNAfold (76). The base colors represent the (unconstrained) partition function base-pairing probabilities associated to the represented structures. Gray structure annotations correspond to RNAalifold consensus structures supported by conserved or compensatory mutations. The substructures outlined in black (bottom right) correspond to the previously characterized mascRNA and associated stem-loop, which are required for efficient RNAse P cleavage (cleavage site indicated with an arrow) (74). Structure representations were created with VARNA (77).

Similar articles

Cited by

References

    1. Clark MB, Amaral PP, Schlesinger FJ, Dinger ME, Taft RJ, Rinn JL, Ponting CP, Stadler PF, Morris KJ, Morillon A, et al. The reality of pervasive transcription. PLoS Biol. 2011;9:e1000625. - PMC - PubMed
    1. Mercer TR, Gerhardt DJ, Dinger ME, Crawford J, Trapnell C, Jeddeloh JA, Mattick JS, Rinn JL. Targeted RNA sequencing reveals the deep complexity of the human transcriptome. Nat. Biotech. 2012;30:99–104. - PMC - PubMed
    1. Djebali S, Davis CA, Merkel A, Dobin A, Lassmann T, Mortazavi A, Tanzer A, Lagarde J, Lin W, Schlesinger F, et al. Landscape of transcription in human cells. Nature. 2012;489:101–108. - PMC - PubMed
    1. Banfai B, Jia H, Khatun J, Wood E, Risk B, Gundling WE, Jr, Kundaje A, Gunawardena HP, Yu Y, Xie L, et al. Long noncoding RNAs are rarely translated in two human cell lines. Genome Res. 2012;22:1646–1657. - PMC - PubMed
    1. Mattick JS. Introns: evolution and function. Curr. Opin. Genet. Dev. 1994;4:823–831. - PubMed

Publication types

Substances