GStream: improving SNP and CNV coverage on genome-wide association studies
- PMID: 23844243
- PMCID: PMC3700900
- DOI: 10.1371/journal.pone.0068822
GStream: improving SNP and CNV coverage on genome-wide association studies
Abstract
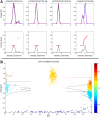
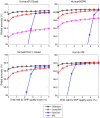
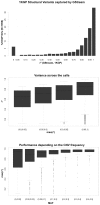
We present GStream, a method that combines genome-wide SNP and CNV genotyping in the Illumina microarray platform with unprecedented accuracy. This new method outperforms previous well-established SNP genotyping software. More importantly, the CNV calling algorithm of GStream dramatically improves the results obtained by previous state-of-the-art methods and yields an accuracy that is close to that obtained by purely CNV-oriented technologies like Comparative Genomic Hybridization (CGH). We demonstrate the superior performance of GStream using microarray data generated from HapMap samples. Using the reference CNV calls generated by the 1000 Genomes Project (1KGP) and well-known studies on whole genome CNV characterization based either on CGH or genotyping microarray technologies, we show that GStream can increase the number of reliably detected variants up to 25% compared to previously developed methods. Furthermore, the increased genome coverage provided by GStream allows the discovery of CNVs in close linkage disequilibrium with SNPs, previously associated with disease risk in published Genome-Wide Association Studies (GWAS). These results could provide important insights into the biological mechanism underlying the detected disease risk association. With GStream, large-scale GWAS will not only benefit from the combined genotyping of SNPs and CNVs at an unprecedented accuracy, but will also take advantage of the computational efficiency of the method.
Conflict of interest statement
Figures


Similar articles
-
Evaluation of copy number variation detection for a SNP array platform.BMC Bioinformatics. 2014 Feb 21;15:50. doi: 10.1186/1471-2105-15-50. BMC Bioinformatics. 2014. PMID: 24555668 Free PMC article.
-
Genome-wide association study of copy number variation with lung function identifies a novel signal of association near BANP for forced vital capacity.BMC Genet. 2016 Aug 11;17(1):116. doi: 10.1186/s12863-016-0423-0. BMC Genet. 2016. PMID: 27514831 Free PMC article.
-
Genome-wide algorithm for detecting CNV associations with diseases.BMC Bioinformatics. 2011 Aug 9;12:331. doi: 10.1186/1471-2105-12-331. BMC Bioinformatics. 2011. PMID: 21827692 Free PMC article.
-
Accuracy of CNV Detection from GWAS Data.PLoS One. 2011 Jan 13;6(1):e14511. doi: 10.1371/journal.pone.0014511. PLoS One. 2011. PMID: 21249187 Free PMC article.
-
A remark on copy number variation detection methods.PLoS One. 2018 Apr 27;13(4):e0196226. doi: 10.1371/journal.pone.0196226. eCollection 2018. PLoS One. 2018. PMID: 29702671 Free PMC article.
Cited by
-
Lack of association between insulin receptor substrate2 rs1805097 polymorphism and the risk of colorectal and breast cancer: a meta-analysis.PLoS One. 2014 Jan 30;9(1):e86911. doi: 10.1371/journal.pone.0086911. eCollection 2014. PLoS One. 2014. PMID: 24497996 Free PMC article.
-
A genome-wide association study identifies a new locus associated with the response to anti-TNF therapy in rheumatoid arthritis.Pharmacogenomics J. 2016 Apr;16(2):147-50. doi: 10.1038/tpj.2015.31. Epub 2015 Apr 21. Pharmacogenomics J. 2016. PMID: 25896534
References
-
- Hirschhorn JN, Gajdos ZK (2011) Genome-wide association studies: results from the first few years and potential implications for clinical medicine. Annual Review of Medicine 62: 11–24. - PubMed
-
- Julià A, Ballina J, Cañete JD, Balsa A, Tornero-Molina J, et al. (2008) Genome-wide association study of rheumatoid arthritis in the Spanish population: KLF12 as a risk locus for rheumatoid arthritis susceptibility. Arthritis & Rheumatism 58: 2275–2286. - PubMed
-
- Ragoussis J (2009) Genotyping Technologies for Genetic Research. Annual Review of Genomics and Human Genetics 10: 117–133. - PubMed
Publication types
MeSH terms
Grants and funding
LinkOut - more resources
Full Text Sources
Other Literature Sources

