

Global efficiency of local immunization on complex networks
- PMID: 23842121
- PMCID: PMC3707349
- DOI: 10.1038/srep02171
Global efficiency of local immunization on complex networks
Abstract
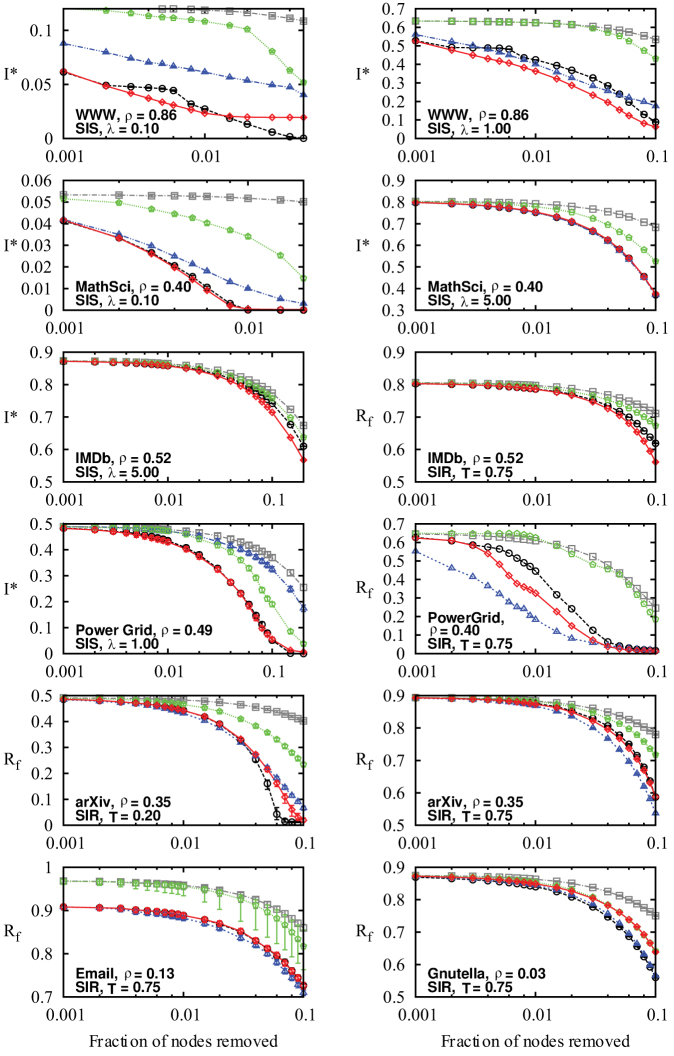
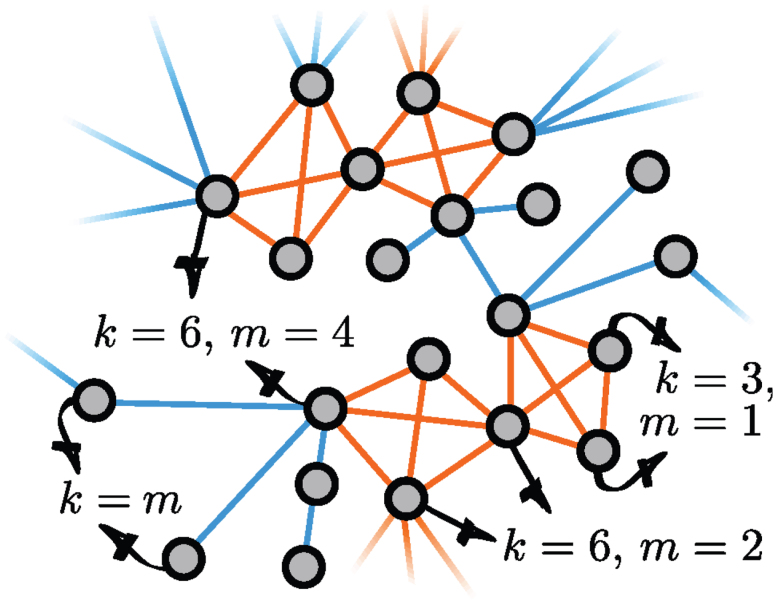
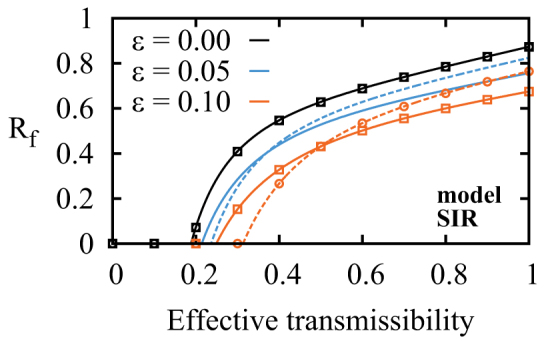
Epidemics occur in all shapes and forms: infections propagating in our sparse sexual networks, rumours and diseases spreading through our much denser social interactions, or viruses circulating on the Internet. With the advent of large databases and efficient analysis algorithms, these processes can be better predicted and controlled. In this study, we use different characteristics of network organization to identify the influential spreaders in 17 empirical networks of diverse nature using 2 epidemic models. We find that a judicious choice of local measures, based either on the network's connectivity at a microscopic scale or on its community structure at a mesoscopic scale, compares favorably to global measures, such as betweenness centrality, in terms of efficiency, practicality and robustness. We also develop an analytical framework that highlights a transition in the characteristic scale of different epidemic regimes. This allows to decide which local measure should govern immunization in a given scenario.
Figures
Similar articles
-
Identifying influential spreaders in complex networks for disease spread and control.Sci Rep. 2022 Apr 1;12(1):5550. doi: 10.1038/s41598-022-09341-3. Sci Rep. 2022. PMID: 35365715 Free PMC article.
-
Comparative analysis of the effectiveness of three immunization strategies in controlling disease outbreaks in realistic social networks.PLoS One. 2014 May 2;9(5):e95911. doi: 10.1371/journal.pone.0095911. eCollection 2014. PLoS One. 2014. PMID: 24787718 Free PMC article.
-
Identification of influential spreaders in complex networks using HybridRank algorithm.Sci Rep. 2018 Aug 9;8(1):11932. doi: 10.1038/s41598-018-30310-2. Sci Rep. 2018. PMID: 30093716 Free PMC article.
-
Suppressing epidemics with a limited amount of immunization units.Phys Rev E Stat Nonlin Soft Matter Phys. 2011 Dec;84(6 Pt 1):061911. doi: 10.1103/PhysRevE.84.061911. Epub 2011 Dec 15. Phys Rev E Stat Nonlin Soft Matter Phys. 2011. PMID: 22304120
-
Immunization of complex networks.Phys Rev E Stat Nonlin Soft Matter Phys. 2002 Mar;65(3 Pt 2A):036104. doi: 10.1103/PhysRevE.65.036104. Epub 2002 Feb 8. Phys Rev E Stat Nonlin Soft Matter Phys. 2002. PMID: 11909162
Cited by
-
Epidemic Wave Dynamics Attributable to Urban Community Structure: A Theoretical Characterization of Disease Transmission in a Large Network.J Med Internet Res. 2015 Jul 8;17(7):e169. doi: 10.2196/jmir.3720. J Med Internet Res. 2015. PMID: 26156032 Free PMC article.
-
Centrality in Complex Networks with Overlapping Community Structure.Sci Rep. 2019 Jul 12;9(1):10133. doi: 10.1038/s41598-019-46507-y. Sci Rep. 2019. PMID: 31300702 Free PMC article.
-
Immunization strategy based on the critical node in percolation transition.Phys Lett A. 2015 Nov 6;379(43):2795-2801. doi: 10.1016/j.physleta.2015.09.017. Epub 2015 Sep 16. Phys Lett A. 2015. PMID: 32288059 Free PMC article.
-
Effective approach to epidemic containment using link equations in complex networks.Sci Adv. 2018 Dec 5;4(12):eaau4212. doi: 10.1126/sciadv.aau4212. eCollection 2018 Dec. Sci Adv. 2018. PMID: 30525105 Free PMC article.
-
Digital contact tracing and network theory to stop the spread of COVID-19 using big-data on human mobility geolocalization.PLoS Comput Biol. 2022 Apr 11;18(4):e1009865. doi: 10.1371/journal.pcbi.1009865. eCollection 2022 Apr. PLoS Comput Biol. 2022. PMID: 35404949 Free PMC article.
References
-
- Caldarelli G. & Vespignani A. Large Scale Structure and Dynamics of Complex Networks. World Scientific Publishing Company, Singapore (2007).
-
- Keeling M. J. & Rohani P. Modeling Infectious Diseases in Humans and Animals Princeton University Press, Princeton (2008).
-
- Anderson R. M. & May R. M. Infectious Diseases of Humans: Dynamics and Control Oxford University Press, New York (1991).
-
- Pastor-Satorras R. & Vespignani A. Epidemic Spreading in Scale-Free Networks. Phys. Rev. Lett. 86, 3200–3203 (2001). - PubMed
Publication types
MeSH terms
Grants and funding
LinkOut - more resources
Full Text Sources
Other Literature Sources
Medical
