Modelling Competing Endogenous RNA Networks
- PMID: 23840508
- PMCID: PMC3694070
- DOI: 10.1371/journal.pone.0066609
Modelling Competing Endogenous RNA Networks
Abstract
MicroRNAs (miRNAs) are small RNA molecules, about 22 nucleotide long, which post-transcriptionally regulate their target messenger RNAs (mRNAs). They accomplish key roles in gene regulatory networks, ranging from signaling pathways to tissue morphogenesis, and their aberrant behavior is often associated with the development of various diseases. Recently it has been experimentally shown that the way miRNAs interact with their targets can be described in terms of a titration mechanism. From a theoretical point of view titration mechanisms are characterized by threshold effect at near-equimolarity of the different chemical species, hypersensitivity of the system around the threshold, and cross-talk among targets. The latter characteristic has been lately identified as competing endogenous RNA (ceRNA) effect to mark those indirect interactions among targets of a common pool of miRNAs they are in competition for. Here we propose a stochastic model to analyze the equilibrium and out-of-equilibrium properties of a network of [Formula: see text] miRNAs interacting with [Formula: see text] mRNA targets. In particular we are able to describe in detail the peculiar equilibrium and non-equilibrium phenomena that the system displays in proximity to the threshold: (i) maximal cross-talk and correlation between targets, (ii) robustness of ceRNA effect with respect to the model's parameters and in particular to the catalyticity of the miRNA-mRNA interaction, and (iii) anomalous response-time to external perturbations.
Conflict of interest statement
Figures

 ) and ceRNA (
 ) present in the network we consider the main steps of transcription (rates
  and
and  respectively) and degradation (rates
  and
and  respectively) plus a titrative interaction between miRNA and ceRNA. miRNA and ceRNA can therefore form a complex
  with effective association rate
  . The parameter
  (the catalyticity parameter) tells which is the probability a miRNA is recycled after having interacted with one of its targets.


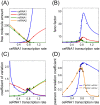
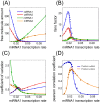
 . The threshold effect is possible only if the system is out of equilibrium (A). Numerical integration of Equation (1) in File S1 leads to time evolution of each molecular species for a given set of parameters. In panels A,C we plot "pictures" of the evolving system at different time
  (panel A
  , panel C
  ) as a function of ceRNA1 transcription rate. When t is smaller than the time complexes need to reach their steady state a threshold effect is observed. In panels B,D we plot the corresponding Pearson's coefficient profiles. Where the threshold effect is present (panel A), a peak in the Pearson's coefficient is also observed.
Similar articles
-
Identification of Serum Exosome-Derived circRNA-miRNA-TF-mRNA Regulatory Network in Postmenopausal Osteoporosis Using Bioinformatics Analysis and Validation in Peripheral Blood-Derived Mononuclear Cells.Front Endocrinol (Lausanne). 2022 Jun 9;13:899503. doi: 10.3389/fendo.2022.899503. eCollection 2022. Front Endocrinol (Lausanne). 2022. PMID: 35757392 Free PMC article.
-
lnCeDB: database of human long noncoding RNA acting as competing endogenous RNA.PLoS One. 2014 Jun 13;9(6):e98965. doi: 10.1371/journal.pone.0098965. eCollection 2014. PLoS One. 2014. PMID: 24926662 Free PMC article.
-
Construction of a competing endogenous RNA network to identify drug targets against polycystic ovary syndrome.Hum Reprod. 2022 Nov 24;37(12):2856-2866. doi: 10.1093/humrep/deac218. Hum Reprod. 2022. PMID: 36223608
-
MicroRNAs and ceRNAs: therapeutic implications of RNA networks.Expert Opin Biol Ther. 2014 Sep;14(9):1285-93. doi: 10.1517/14712598.2014.920812. Epub 2014 Jun 18. Expert Opin Biol Ther. 2014. PMID: 24941322 Review.
-
Kinetic Modelling of Competition and Depletion of Shared miRNAs by Competing Endogenous RNAs.Methods Mol Biol. 2019;1912:367-409. doi: 10.1007/978-1-4939-8982-9_15. Methods Mol Biol. 2019. PMID: 30635902 Review.
Cited by
-
On the availability of microRNA-induced silencing complexes, saturation of microRNA-binding sites and stoichiometry.Nucleic Acids Res. 2015 Sep 3;43(15):7556-65. doi: 10.1093/nar/gkv720. Epub 2015 Jul 30. Nucleic Acids Res. 2015. PMID: 26227970 Free PMC article.
-
Integrated transcriptional and competitive endogenous RNA networks are cross-regulated in permissive molecular environments.Proc Natl Acad Sci U S A. 2013 Apr 30;110(18):7154-9. doi: 10.1073/pnas.1222509110. Epub 2013 Mar 27. Proc Natl Acad Sci U S A. 2013. PMID: 23536298 Free PMC article.
-
Kindlin-2-mediated upregulation of ZEB2 facilitates migration and invasion of oral squamous cell carcinoma in a miR-200b-dependent manner.Am J Transl Res. 2018 Aug 15;10(8):2529-2541. eCollection 2018. Am J Transl Res. 2018. PMID: 30210690 Free PMC article.
-
Single-cell mRNA profiling reveals the hierarchical response of miRNA targets to miRNA induction.Mol Syst Biol. 2018 Aug 27;14(8):e8266. doi: 10.15252/msb.20188266. Mol Syst Biol. 2018. PMID: 30150282 Free PMC article.
-
Illuminating lncRNA Function Through Target Prediction.Methods Mol Biol. 2021;2372:263-295. doi: 10.1007/978-1-0716-1697-0_22. Methods Mol Biol. 2021. PMID: 34417758
References
-
- Winter J, Jung S, Keller S, Gregory R, Diederichs S (2009) Many roads to maturity: microrna biogenesis pathways and their regulation. Nature cell biology 11: 228–34. - PubMed
Publication types
MeSH terms
Substances
Grants and funding
LinkOut - more resources
Full Text Sources
Other Literature Sources

