Circumventing embryonic lethality with Lcmt1 deficiency: generation of hypomorphic Lcmt1 mice with reduced protein phosphatase 2A methyltransferase expression and defects in insulin signaling
- PMID: 23840384
- PMCID: PMC3688711
- DOI: 10.1371/journal.pone.0065967
Circumventing embryonic lethality with Lcmt1 deficiency: generation of hypomorphic Lcmt1 mice with reduced protein phosphatase 2A methyltransferase expression and defects in insulin signaling
Abstract
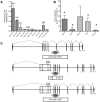
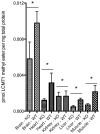
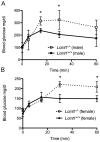
Protein phosphatase 2A (PP2A), the major serine/threonine phosphatase in eukaryotic cells, is a heterotrimeric protein composed of structural, catalytic, and targeting subunits. PP2A assembly is governed by a variety of mechanisms, one of which is carboxyl-terminal methylation of the catalytic subunit by the leucine carboxyl methyltransferase LCMT1. PP2A is nearly stoichiometrically methylated in the cytosol, and although some PP2A targeting subunits bind independently of methylation, this modification is required for the binding of others. To examine the role of this methylation reaction in mammalian tissues, we generated a mouse harboring a gene-trap cassette within intron 1 of Lcmt1. Due to splicing around the insertion, Lcmt1 transcript and LCMT1 protein levels were reduced but not eliminated. LCMT1 activity and methylation of PP2A were reduced in a coordinate fashion, suggesting that LCMT1 is the only PP2A methyltransferase. These mice exhibited an insulin-resistance phenotype, indicating a role for this methyltransferase in signaling in insulin-sensitive tissues. Tissues from these animals will be vital for the in vivo identification of methylation-sensitive substrates of PP2A and how they respond to differing physiological conditions.
Conflict of interest statement
Figures


Similar articles
-
Leucine carboxyl methyltransferase 1 (LCMT1)-dependent methylation regulates the association of protein phosphatase 2A and Tau protein with plasma membrane microdomains in neuroblastoma cells.J Biol Chem. 2013 Sep 20;288(38):27396-27405. doi: 10.1074/jbc.M113.490102. Epub 2013 Aug 13. J Biol Chem. 2013. PMID: 23943618 Free PMC article.
-
H2 O2 induces PP2A demethylation to downregulate mTORC1 signaling in HEK293 cells.Cell Biol Int. 2018 Sep;42(9):1182-1191. doi: 10.1002/cbin.10987. Epub 2018 Jun 13. Cell Biol Int. 2018. PMID: 29752834
-
Leucine Carboxyl Methyltransferase 1 (LCMT-1) Methylates Protein Phosphatase 4 (PP4) and Protein Phosphatase 6 (PP6) and Differentially Regulates the Stable Formation of Different PP4 Holoenzymes.J Biol Chem. 2016 Sep 30;291(40):21008-21019. doi: 10.1074/jbc.M116.739920. Epub 2016 Aug 9. J Biol Chem. 2016. PMID: 27507813 Free PMC article.
-
Effects of carboxyl-terminal methylation on holoenzyme function of the PP2A subfamily.Biochem Soc Trans. 2020 Oct 30;48(5):2015-2027. doi: 10.1042/BST20200177. Biochem Soc Trans. 2020. PMID: 33125487 Free PMC article. Review.
-
The biogenesis of active protein phosphatase 2A holoenzymes: a tightly regulated process creating phosphatase specificity.FEBS J. 2013 Jan;280(2):644-61. doi: 10.1111/j.1742-4658.2012.08579.x. Epub 2012 Apr 25. FEBS J. 2013. PMID: 22443683 Review.
Cited by
-
Reduced Expression of the PP2A Methylesterase, PME-1, or the PP2A Methyltransferase, LCMT-1, Alters Sensitivity to Beta-Amyloid-Induced Cognitive and Electrophysiological Impairments in Mice.J Neurosci. 2020 Jun 3;40(23):4596-4608. doi: 10.1523/JNEUROSCI.2983-19.2020. Epub 2020 Apr 27. J Neurosci. 2020. PMID: 32341098 Free PMC article.
-
Global loss of leucine carboxyl methyltransferase-1 causes severe defects in fetal liver hematopoiesis.J Biol Chem. 2018 Jun 22;293(25):9636-9650. doi: 10.1074/jbc.RA118.002012. Epub 2018 May 7. J Biol Chem. 2018. PMID: 29735529 Free PMC article.
-
Therapeutic targeting of PP2A.Int J Biochem Cell Biol. 2018 Mar;96:182-193. doi: 10.1016/j.biocel.2017.10.008. Epub 2017 Oct 26. Int J Biochem Cell Biol. 2018. PMID: 29107183 Free PMC article. Review.
-
Changes in Carboxy Methylation and Tyrosine Phosphorylation of Protein Phosphatase PP2A Are Associated with Epididymal Sperm Maturation and Motility.PLoS One. 2015 Nov 16;10(11):e0141961. doi: 10.1371/journal.pone.0141961. eCollection 2015. PLoS One. 2015. PMID: 26569399 Free PMC article.
-
Altered protein phosphatase 2A methylation and Tau phosphorylation in the young and aged brain of methylenetetrahydrofolate reductase (MTHFR) deficient mice.Front Aging Neurosci. 2014 Aug 22;6:214. doi: 10.3389/fnagi.2014.00214. eCollection 2014. Front Aging Neurosci. 2014. PMID: 25202269 Free PMC article.
References
Publication types
MeSH terms
Substances
Grants and funding
LinkOut - more resources
Full Text Sources
Other Literature Sources
Medical
Molecular Biology Databases

