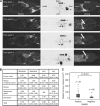
Ewing sarcoma dissemination and response to T-cell therapy in mice assessed by whole-body magnetic resonance imaging
- PMID: 23839490
- PMCID: PMC3738111
- DOI: 10.1038/bjc.2013.356
Ewing sarcoma dissemination and response to T-cell therapy in mice assessed by whole-body magnetic resonance imaging
Abstract
Background: Novel treatment strategies in Ewing sarcoma include targeted cellular therapies. Preclinical in vivo models are needed that reflect their activity against systemic (micro)metastatic disease.
Methods: Whole-body magnetic resonance imaging (WB-MRI) was used to monitor the engraftment and dissemination of human Ewing sarcoma xenografts in mice. In this model, we evaluated the therapeutic efficacy of T cells redirected against the Ewing sarcoma-associated antigen GD2 by chimeric receptor engineering.
Results: Of 18 mice receiving intravenous injections of VH-64 Ewing sarcoma cells, all developed disseminated tumour growth detectable by WB-MRI. All mice had lung tumours, and the majority had additional manifestations in the bone, soft tissues, and/or kidney. Sequential scans revealed in vivo growth of tumours. Diffusion-weighted whole-body imaging with background signal suppression effectively visualised Ewing sarcoma growth in extrapulmonary sites. Animals receiving GD2-targeted T-cell therapy had lower numbers of pulmonary tumours than controls, and the median volume of soft tissue tumours at first detection was lower, with a tumour growth delay over time.
Conclusion: Magnetic resonance imaging reliably visualises disseminated Ewing sarcoma growth in mice. GD2-retargeted T cells can noticeably delay tumour growth and reduce pulmonary Ewing sarcoma manifestations in this aggressive disease model.
Figures


Similar articles
-
The ganglioside antigen G(D2) is surface-expressed in Ewing sarcoma and allows for MHC-independent immune targeting.Br J Cancer. 2012 Mar 13;106(6):1123-33. doi: 10.1038/bjc.2012.57. Epub 2012 Feb 28. Br J Cancer. 2012. PMID: 22374462 Free PMC article.
-
EZH2 Inhibition in Ewing Sarcoma Upregulates GD2 Expression for Targeting with Gene-Modified T Cells.Mol Ther. 2019 May 8;27(5):933-946. doi: 10.1016/j.ymthe.2019.02.014. Epub 2019 Feb 23. Mol Ther. 2019. PMID: 30879952 Free PMC article.
-
Development of a preclinical orthotopic xenograft model of ewing sarcoma and other human malignant bone disease using advanced in vivo imaging.PLoS One. 2014 Jan 7;9(1):e85128. doi: 10.1371/journal.pone.0085128. eCollection 2014. PLoS One. 2014. PMID: 24409320 Free PMC article.
-
Cellular immunotherapy strategies for Ewing sarcoma.Immunotherapy. 2014;6(5):611-21. doi: 10.2217/imt.14.36. Immunotherapy. 2014. PMID: 24896629 Review.
-
Targeting the tumor microenvironment of Ewing sarcoma.Immunotherapy. 2021 Dec;13(17):1439-1451. doi: 10.2217/imt-2020-0341. Epub 2021 Oct 21. Immunotherapy. 2021. PMID: 34670399 Review.
Cited by
-
Sequencing Overview of Ewing Sarcoma: A Journey across Genomic, Epigenomic and Transcriptomic Landscapes.Int J Mol Sci. 2015 Jul 16;16(7):16176-215. doi: 10.3390/ijms160716176. Int J Mol Sci. 2015. PMID: 26193259 Free PMC article. Review.
-
The efficacy and applicability of chimeric antigen receptor (CAR) T cell-based regimens for primary bone tumors: A comprehensive review of current evidence.J Bone Oncol. 2024 Sep 22;48:100635. doi: 10.1016/j.jbo.2024.100635. eCollection 2024 Oct. J Bone Oncol. 2024. PMID: 39381633 Free PMC article. Review.
-
Immunotherapy in soft tissue and bone sarcoma: unraveling the barriers to effectiveness.Theranostics. 2022 Aug 15;12(14):6106-6129. doi: 10.7150/thno.72800. eCollection 2022. Theranostics. 2022. PMID: 36168619 Free PMC article. Review.
-
Multimodal Imaging of Orthotopic Mouse Model of Endometrial Carcinoma.PLoS One. 2015 Aug 7;10(8):e0135220. doi: 10.1371/journal.pone.0135220. eCollection 2015. PLoS One. 2015. PMID: 26252891 Free PMC article.
-
New strategies in ewing sarcoma: lost in translation?Clin Cancer Res. 2014 Jun 15;20(12):3050-6. doi: 10.1158/1078-0432.CCR-13-0633. Epub 2014 Apr 22. Clin Cancer Res. 2014. PMID: 24756371 Free PMC article.
References
-
- Altehoefer C, Ghanem N, Hogerle S, Moser E, Langer M. Comparative detectability of bone metastases and impact on therapy of magnetic resonance imaging and bone scintigraphy in patients with breast cancer. Eur J Radiol. 2001;40:16–23. - PubMed
-
- Brentjens RJ, Riviere I, Park JH, Davila ML, Wang X, Stefanski J, Taylor C, Yeh R, Bartido S, Borquez-Ojeda O, Olszewska M, Bernal Y, Pegram H, Przybylowski M, Hollyman D, Usachenko Y, Pirraglia D, Hosey J, Santos E, Halton E, Maslak P, Scheinberg D, Jurcic J, Heaney M, Heller G, Frattini M, Sadelain M. Safety and persistence of adoptively transferred autologous CD19-targeted T cells in patients with relapsed or chemotherapy refractory B-cell leukemias. Blood. 2011;118:4817–4828. - PMC - PubMed
-
- Delattre O, Zucman J, Plougastel B, Desmaze C, Melot T, Peter M, Kovar H, Joubert I, De Jong P, Rouleau G. Gene fusion with an ETS DNA-binding domain caused by chromosome translocation in human tumours. Nature. 1992;359:162–165. - PubMed
Publication types
MeSH terms
Substances
LinkOut - more resources
Full Text Sources
Other Literature Sources
Medical

