. 2013 Aug 15;122(7):1150-61.
doi: 10.1182/blood-2011-01-331819. Epub 2013 Jul 8.

Genetic interaction between Kit and Scl

Affiliations

Genetic interaction between Kit and Scl

Julie Lacombe et al. Blood. .

Abstract

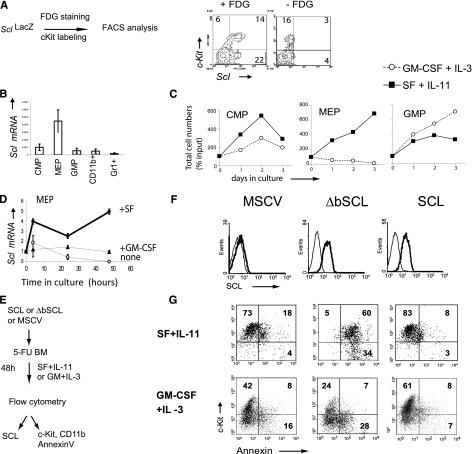
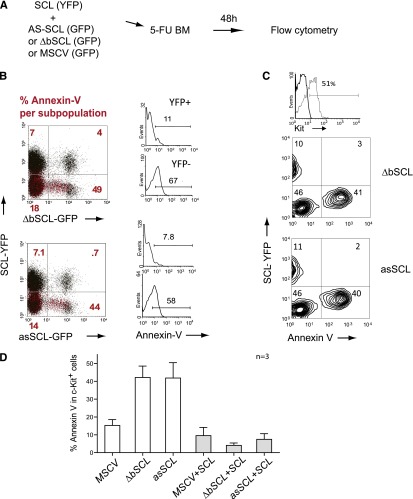
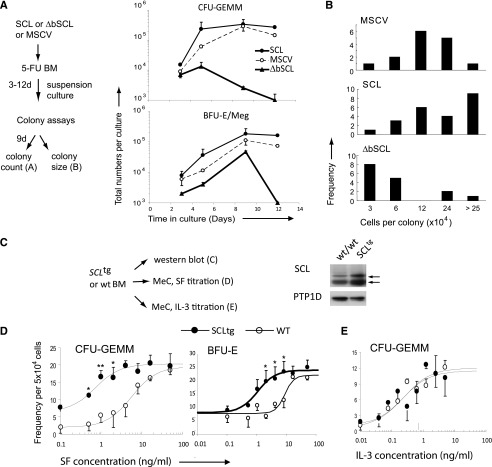
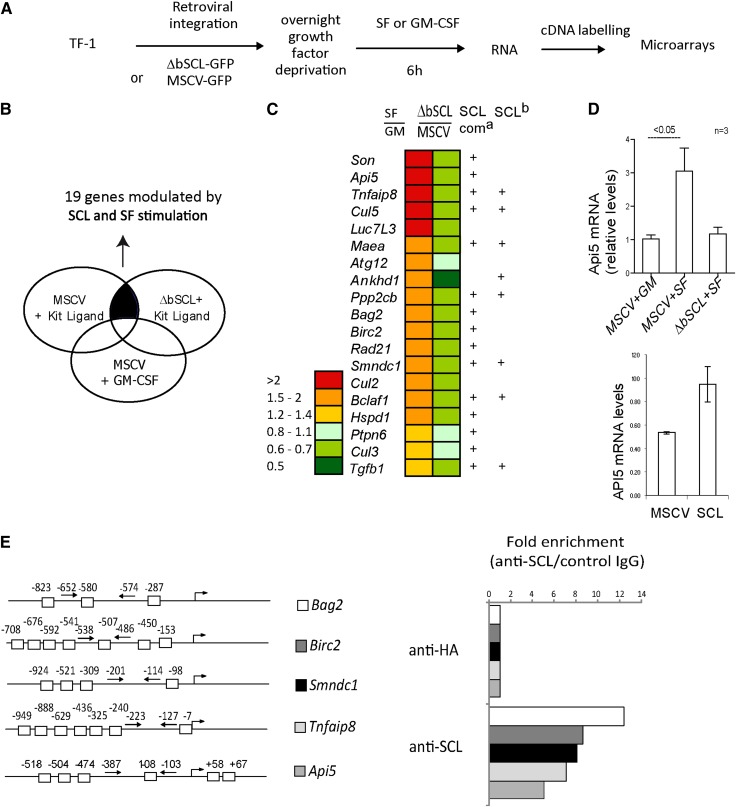
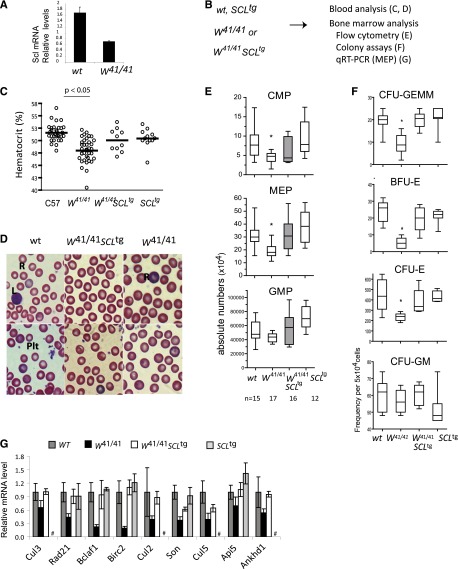
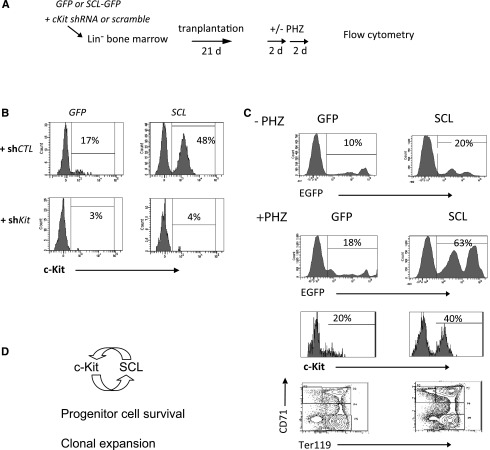
SCL/TAL1, a tissue-specific transcription factor of the basic helix-loop-helix family, and c-Kit, a tyrosine kinase receptor, control hematopoietic stem cell survival and quiescence. Here we report that SCL levels are limiting for the clonal expansion of Kit⁺ multipotent and erythroid progenitors. In addition, increased SCL expression specifically enhances the sensitivity of these progenitors to steel factor (KIT ligand) without affecting interleukin-3 response, whereas a DNA-binding mutant antagonizes KIT function and induces apoptosis in progenitors. Furthermore, a twofold increase in SCL levels in mice bearing a hypomorphic Kit allele (W41/41) corrects their hematocrits and deficiencies in erythroid progenitor numbers. At the molecular level, we found that SCL and c-Kit signaling control a common gene expression signature, of which 19 genes are associated with apoptosis. Half of those were decreased in purified megakaryocyte/erythroid progenitors (MEPs) from W41/41 mice and rescued by the SCL transgene. We conclude that Scl operates downstream of Kit to support the survival of MEPs. Finally, higher SCL expression upregulates Kit in normal bone marrow cells and increases chimerism after bone marrow transplantation, indicating that Scl is also upstream of Kit. We conclude that Scl and Kit establish a positive feedback loop in multipotent and MEPs.


Figures

Figure 1
Figure 1
SCL is expressed in Kit+ cells and controls Kit-dependent cell survival. (A) Hematopoietic progenitors coexpress Scl and Kit. Scl gene transcription was monitored by β-galactosidase staining (+FDG) of bone marrow cells from SclLacZ mice. The substrate was omitted in the negative control (–FDG). (B) Kit+ populations enriched in hematopoietic progenitors, CMP, MEP, and GMP, were purified from wild-type (WT) bone marrows. Scl expression was analyzed by quantitative RT-PCR. Messenger (mRNA) levels were normalized using Hprt as an internal control. The means ± standard deviation (SD) of 3 experiments are shown. (C) These progenitors were maintained in culture with SF and IL-11 or GM-CSF and IL-3. Viable cell counts were monitored at the indicated times. (D) SF but not GM-CSF stimulation of Kit+ScaLin progenitors upregulates Scl mRNA. Purified Kit+Sca-1Lin progenitors were stimulated with SF, GM-CSF, or control medium. Scl expression was determined at different time points by quantitative RT-PCR. mRNA levels were normalized using S16 as an internal control and then compared with expression levels at t = 0. (E) Strategy used to test the role of Scl in the survival of Kit+ cells. The 5-fluorouracil (5-FU) mouse bone marrow cells were infected with MSCV-neor retrovirus carrying human SCL, a DNA-binding defective mutant (ΔbSCL), or the control empty vector. (F) Kit+ cells were analyzed for the presence of human SCL by immunofluorescence staining with a monoclonal mouse anti-human SCL (thick line). Staining with the secondary antibody alone (goat anti-mouse) served as negative control (thin line). (G) After retroviral infection, cells were stimulated with either early acting cytokines (SF + IL-11) or myeloid cytokines (GM-CSF + IL-3) for 2 days in selective media (G418) prior to staining with Kit antibodies and Annexin V (20% to 25% infection efficiency). Dead cells were excluded from analysis by propidium iodide staining. The numbers shown represent the percentages of cells within each quadrant. Data shown (A-G) are typical of 2 or 3 independent experiments.
Figure 2
Figure 2
SCL rescues apoptosis induced a by a dominant negative or an antisense Scl in Kit+ hematopoietic progenitors. (A) SCL-YFP and ΔbSCL-GFP or SCL-YFP and asSCL-GFP were codelivered in WT bone marrow cells for 2 days, and apoptosis was monitored 48 hours after infection. (B) Annexin-V positive cells are illustrated in red. Note that red dots are present in the YFP fractions, exclusively. Numbers in red represent the % of Annexin-V+ cells within each quadrant. (C) SCL-YFP+ and SCL-YFP fractions were further analyzed for Kit expression and Annexin-V labeling in ΔbSCL- or asSCL-expressing cells. (D) Apoptosis in Kit+ cells. Data shown are the mean ± SD of n independent experiments.
Figure 3
Figure 3
SCL level determines the output of hematopoietic progenitors. (A) WT bone marrow cells expressing either SCL, ΔbSCL, or control empty vector were plated in suspension culture with SF and IL-11 in selective media (G418). Samples were taken at the indicated times and plated in methylcellulose, and colonies were scored 9 days later. Represented are the cumulative growth curves of multipotent progenitors (CFU-GEMM) (upper panel) or MEPs (BFU-E/Meg) in culture. (B) Bone marrow cells expressing the indicated genes were plated in methylcellulose, and multipotent colonies were aspirated 9 days later, dispersed into single-cell suspensions and counted to determine colony size. Data shown (A-B) are typical of at least 2 independent experiments. (C) Western blot of total protein extracts from unfractionated bone marrow was used to assess SCL protein levels in WT and SCLtg mice. α-Protein tyrosine phosphatase 1D was used as a loading control. (D-E) Bone marrow cells from heterozygous SCLtg mice and WT littermates were cultured in methylcellulose in the presence of increasing concentrations of SF (D) or IL-3 (E). Multipotent colonies (CFU-GEMM) were scored 9 days later. Data represent the mean ± SD of 3 independent experiments performed in duplicate or quadruplicate. Data were analyzed using a nonlinear regression curve fitting routine (ALLFIT). Estimates of the half-effective concentrations of the different ligands on progenitors from SCLtg mice or WT littermates were as follows: 0.7 ± 0.4 (SCLtg) and 6 ± 3 (WT) ng/mL of SF for CFU-GEMMs or BFU-Es, and 0.2 ± 0.2 (SCLtg) and 0.2 ± 0.1 (WT) ng/mL of IL-3. *P < .05; **P < .01.
Figure 4
Figure 4
SCL regulates the expression of survival genes in progenitors. (A) Strategy used to identify genes controlled by SCL and Kit in human CD34+ TF-1 cells. (B) Schematic diagram representing our approach to analyze microarray data. We performed a paired comparison between TF-1 cells stimulated with either SF or GM-CSF and TF-1 cells harboring either the empty vector or the ΔbSCL under SF treatment. Nineteen survival genes were found to be coregulated by SCL and Kit signaling. (C) Relative expression levels for the 19 genes modulated by SCL and Kit. Ratio of gene expression levels of control cells (MSCV) stimulated with SF over GM-CSF, and of ΔbSCL-expressing cells over control cells, both stimulated with SF. a, ChIP-Seq peaks identified by Wilson et al with anti-SCL, LMO2, or GATA-1 antibodies; b, ChIP-Seq peaks identified by Kassouf et al with anti-SCL. (D) TF-1 cells harboring either the empty vector or ΔbSCL were treated with GM-CSF or SF (upper panel), or TF-1 cells expressing SCL were treated with GM-CSF (lower panel). Api-5 mRNA levels were assessed by semiquantitative RT-PCR. Data shown are the means ± SD of n experiments. (E) SCL occupies several loci by ChIP. E boxes within the proximal promoters of the indicated genes are shown (left panel). TF-1 cell chromatin extracts were subjected to immunoprecipitation with SCL antibody or with species-matched control immunoglobulin G (right panel). Fold enrichments were calculated as described in “Materials and methods.”
Figure 5
Figure 5
Genetic interaction between Kit and SCL. (A) Scl mRNA levels in purified MEPs from WT and W41/41 mice. (B) Strategy used to test the genetic interaction between Scl and Kit. (C) The SCL transgene rescues the hematocrit of W41/41 mice. Blood from 8- to 12-week-old mice was analyzed, and the hematocrits of individual mice and the mean of each group are illustrated. W41/41 mice exhibit decreased hematocrits compared with age-matched controls (P < .05), which were corrected by the SCL transgene (P = .05). (D) Blood smears from 8- to 12-week-old mice. L, lymphocyte; Plt, platelets R, polychromatophilic erythrocyte (reticulocyte). Two hundred to 300 cells on 2 different slides were scored per mouse (n = 6 for W41/41, and n = 3 for the other genotypes). (E) Analysis of progenitor-enriched populations by flow cytometry. The absolute numbers of progenitors per mice are shown as box plots for n mice of each genotype. *P < .05 compared with wt controls. (F) Bone marrow cells from wt, W41/41, W41/41-SCLtg, and SCLtg mice were cultured in methyl-cellulose, and the frequency of early (BFU-E) and late erythroid progenitors (CFU-E) as well as multipotent (CFU-GEMM) and myeloid progenitors (CFU-GM) was determined. Cultures were performed in triplicate, and data are shown as box plots with the medians as well as the 2 extreme values of each distribution. For CFU-GEMM, CFU-E, and BFU-E, the differences between wt and W41/41, and between W41/41 and W41/41-SCLtg were significant. *P < .05. In contrast, the number of colonies obtained from W41/41-SCLtg and WT mice was not significantly different (P > .1). (G) Gene expression analysis for MEPs from wt, W41/41, W41/41-SCLtg, and SCLtg mice. Expression levels of genes identified in Figure 4C were determined by quantitative RT-PCR. mRNA levels were normalized using Hprt as an internal control, and the expression levels in wt MEPs were set as 1. Shown are the averages ± SD of 2 experiments performed in triplicate (# not determined).
Figure 6
Figure 6
Higher SCL levels upregulate Kit expression. (A) Bone marrow cells were infected with SCL-GFP or the empty GFP vector for 48 hours. Kit shRNA or a control scramble sequence was then delivered by lentiviruses for 24 hours. After puromycin selection for 48 hours, cells were then transplanted into irradiated hosts. Three weeks later, mice were challenged with 2 doses of phenylhydrazine (PHZ) over 4 days. (B) Bone marrow cells were analyzed for c-Kit expression, within the GFP+Lin fraction. (C) Donor-derived reconstitution (GFP) in control mice (–PHZ) and PHZ-treated mice (+PHZ). Kit+Lin cells and erythroid differentiation (TER119/CD71) were analyzed in the GFP+ fraction of PHZ-treated mice. (D) Model of a positive feedback loop between c-Kit and SCL. Ligand-activated c-Kit upregulates Scl expression. Higher SCL levels further activate Kit transcription and increase bone marrow reconstitution.

Similar articles

Cited by

References

    1. Laslo P, Spooner CJ, Warmflash A, et al. Multilineage transcriptional priming and determination of alternate hematopoietic cell fates. Cell. 2006;126(4):755–766. - PubMed
    1. Kent D, Copley M, Benz C, Dykstra B, Bowie M, Eaves C. Regulation of hematopoietic stem cells by the steel factor/KIT signaling pathway. Clin Cancer Res. 2008;14(7):1926–1930. - PubMed
    1. McCulloch EA, Siminovitch L, Till JE, Russell ES, Bernstein SE. The cellular basis of the genetically determined hemopoietic defect in anemic mice of genotype Sl-Sld. Blood. 1965;26(4):399–410. - PubMed
    1. McCulloch EA, Siminovitch L, Till JE. Spleen-colony formation in anemic mice of genotype WW. Science. 1964;144(3620):844–846. - PubMed
    1. Nocka K, Majumder S, Chabot B, et al. Expression of c-kit gene products in known cellular targets of W mutations in normal and W mutant mice—evidence for an impaired c-kit kinase in mutant mice. Genes Dev. 1989;3(6):816–826. - PubMed

Publication types

MeSH terms

Associated data