The developmental transcriptome of the mosquito Aedes aegypti, an invasive species and major arbovirus vector
- PMID: 23833213
- PMCID: PMC3755910
- DOI: 10.1534/g3.113.006742
The developmental transcriptome of the mosquito Aedes aegypti, an invasive species and major arbovirus vector
Abstract
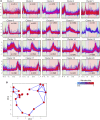
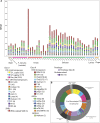
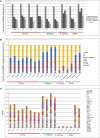
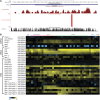
Mosquitoes are vectors of a number of important human and animal diseases. The development of novel vector control strategies requires a thorough understanding of mosquito biology. To facilitate this, we used RNA-seq to identify novel genes and provide the first high-resolution view of the transcriptome throughout development and in response to blood feeding in a mosquito vector of human disease, Aedes aegypti, the primary vector for Dengue and yellow fever. We characterized mRNA expression at 34 distinct time points throughout Aedes development, including adult somatic and germline tissues, by using polyA+ RNA-seq. We identify a total of 14,238 novel new transcribed regions corresponding to 12,597 new loci, as well as many novel transcript isoforms of previously annotated genes. Altogether these results increase the annotated fraction of the transcribed genome into long polyA+ RNAs by more than twofold. We also identified a number of patterns of shared gene expression, as well as genes and/or exons expressed sex-specifically or sex-differentially. Expression profiles of small RNAs in ovaries, early embryos, testes, and adult male and female somatic tissues also were determined, resulting in the identification of 38 new Aedes-specific miRNAs, and ~291,000 small RNA new transcribed regions, many of which are likely to be endogenous small-interfering RNAs and Piwi-interacting RNAs. Genes of potential interest for transgene-based vector control strategies also are highlighted. Our data have been incorporated into a user-friendly genome browser located at www.Aedes.caltech.edu, with relevant links to Vectorbase (www.vectorbase.org).
Keywords: Aedes aegypti; Medea; chikungunya; dengue fever; gene drive; malaria; population replacement; transcriptomes; yellow fever.
Figures


Similar articles
-
Small RNA Profiling in Dengue Virus 2-Infected Aedes Mosquito Cells Reveals Viral piRNAs and Novel Host miRNAs.PLoS Negl Trop Dis. 2016 Feb 25;10(2):e0004452. doi: 10.1371/journal.pntd.0004452. eCollection 2016 Feb. PLoS Negl Trop Dis. 2016. PMID: 26914027 Free PMC article.
-
The Developmental Transcriptome of Aedes albopictus, a Major Worldwide Human Disease Vector.G3 (Bethesda). 2020 Mar 5;10(3):1051-1062. doi: 10.1534/g3.119.401006. G3 (Bethesda). 2020. PMID: 31964684 Free PMC article.
-
Assessing the Potential Interactions between Cellular miRNA and Arboviral Genomic RNA in the Yellow Fever Mosquito, Aedes aegypti.Viruses. 2019 Jun 10;11(6):540. doi: 10.3390/v11060540. Viruses. 2019. PMID: 31185697 Free PMC article.
-
Deducing the Role of Virus Genome-Derived PIWI-Associated RNAs in the Mosquito-Arbovirus Arms Race.Front Genet. 2019 Nov 28;10:1114. doi: 10.3389/fgene.2019.01114. eCollection 2019. Front Genet. 2019. PMID: 31850054 Free PMC article. Review.
-
Developing arbovirus resistance in mosquitoes.Insect Biochem Mol Biol. 2002 Oct;32(10):1333-43. doi: 10.1016/s0965-1748(02)00096-6. Insect Biochem Mol Biol. 2002. PMID: 12225924 Review.
Cited by
-
Efficient sex separation by exploiting differential alternative splicing of a dominant marker in Aedes aegypti.PLoS Genet. 2023 Nov 27;19(11):e1011065. doi: 10.1371/journal.pgen.1011065. eCollection 2023 Nov. PLoS Genet. 2023. PMID: 38011259 Free PMC article.
-
Transcriptome analysis between invasive Pomacea canaliculata and indigenous Cipangopaludina cahayensis reveals genomic divergence and diagnostic microsatellite/SSR markers.BMC Genet. 2015 Feb 11;16(1):12. doi: 10.1186/s12863-015-0175-2. BMC Genet. 2015. PMID: 25888264 Free PMC article.
-
Systematic identification and characterization of Aedes aegypti long noncoding RNAs (lncRNAs).Sci Rep. 2019 Aug 21;9(1):12147. doi: 10.1038/s41598-019-47506-9. Sci Rep. 2019. PMID: 31434910 Free PMC article.
-
MicroRNAs of two medically important mosquito species: Aedes aegypti and Anopheles stephensi.Insect Mol Biol. 2015 Apr;24(2):240-52. doi: 10.1111/imb.12152. Epub 2014 Nov 24. Insect Mol Biol. 2015. PMID: 25420875 Free PMC article.
-
Identification and Characterization of MicroRNAs in Gonads of Helicoverpa armigera (Lepidoptera: Noctuidae).Insects. 2021 Aug 19;12(8):749. doi: 10.3390/insects12080749. Insects. 2021. PMID: 34442315 Free PMC article.
References
-
- Alphey L., Nimmo D., O’Connell S., Alphey N., 2008. Insect population suppression using engineered insects. Adv. Exp. Med. Biol. 627: 93–103 - PubMed
Publication types
MeSH terms
Substances
Grants and funding
LinkOut - more resources
Full Text Sources
Other Literature Sources
Molecular Biology Databases
