

Redox-linked conformational control of proton-coupled electron transfer: Y122 in the ribonucleotide reductase β2 subunit
- PMID: 23822111
- PMCID: PMC3757525
- DOI: 10.1021/jp404757r
Redox-linked conformational control of proton-coupled electron transfer: Y122 in the ribonucleotide reductase β2 subunit
Abstract
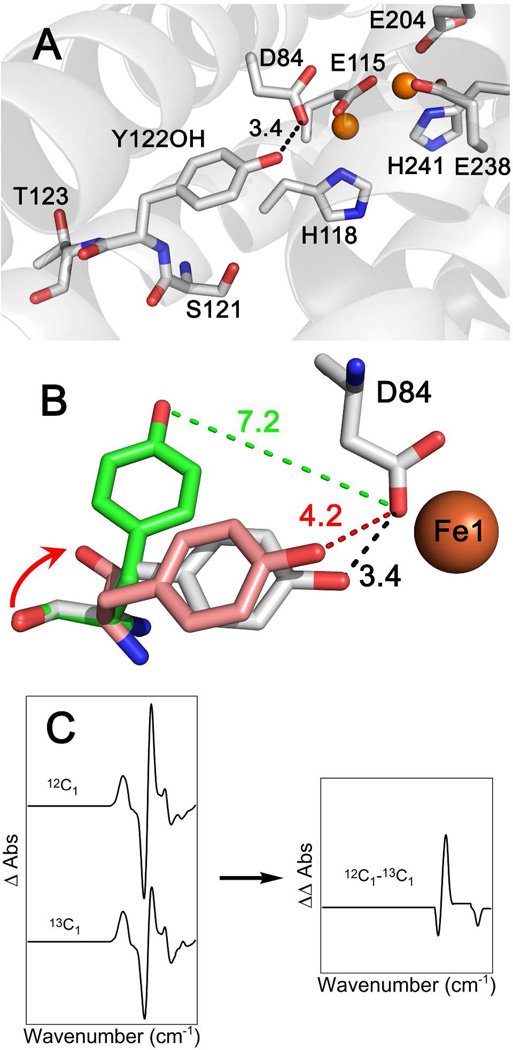
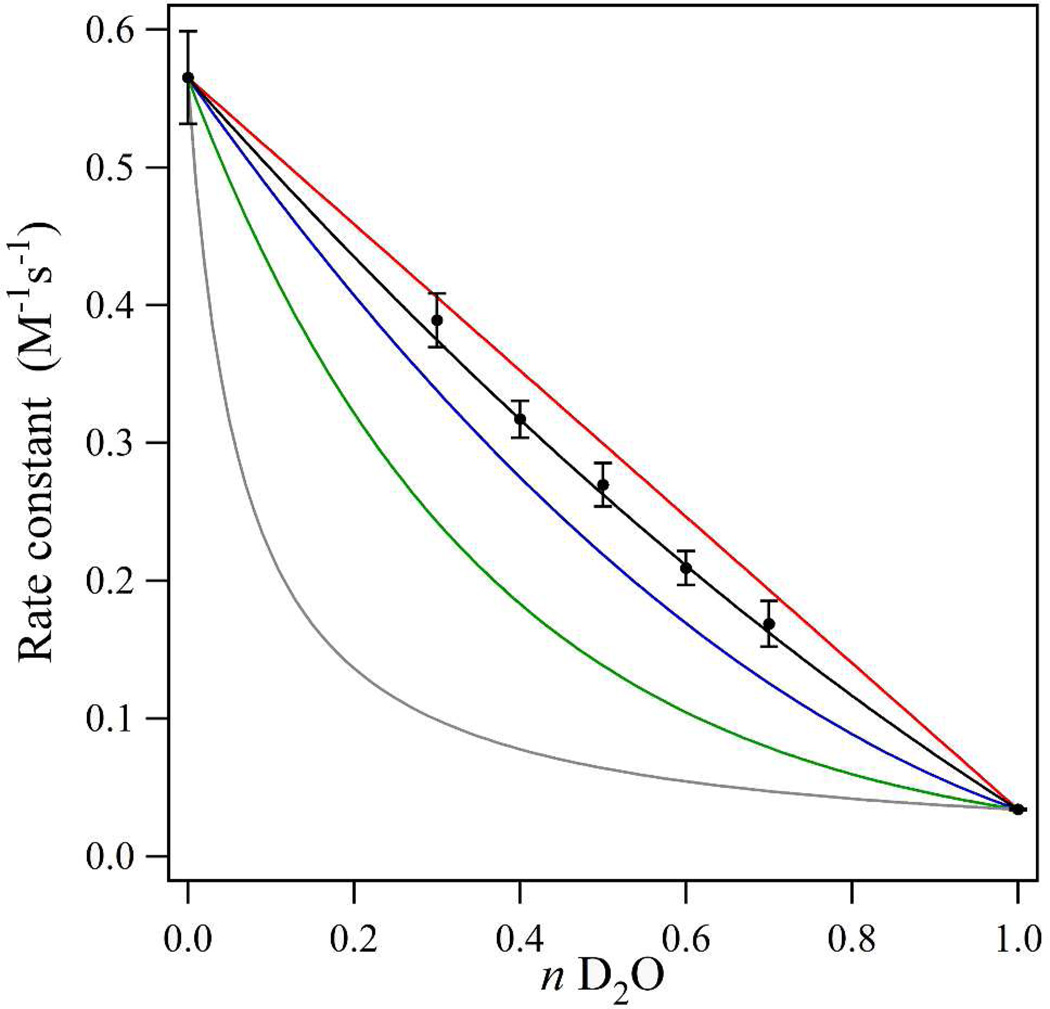
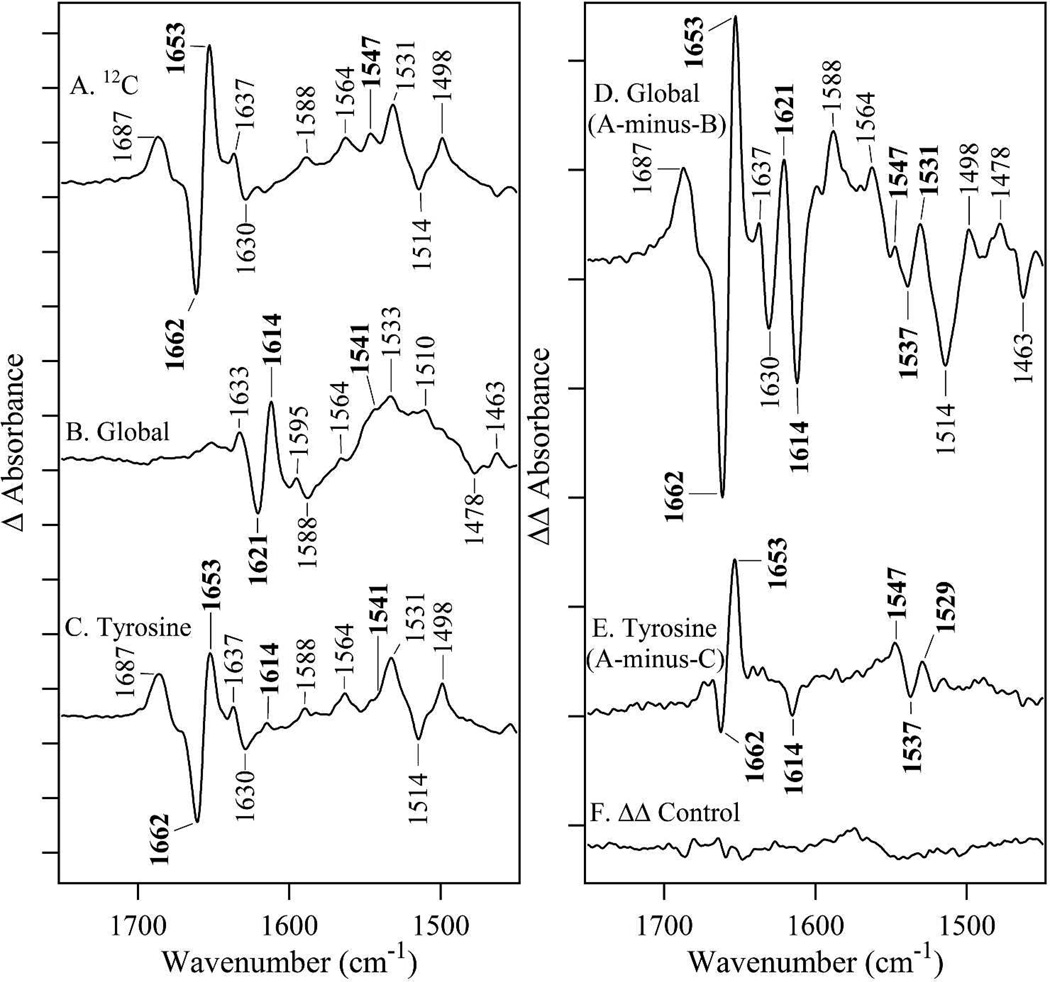
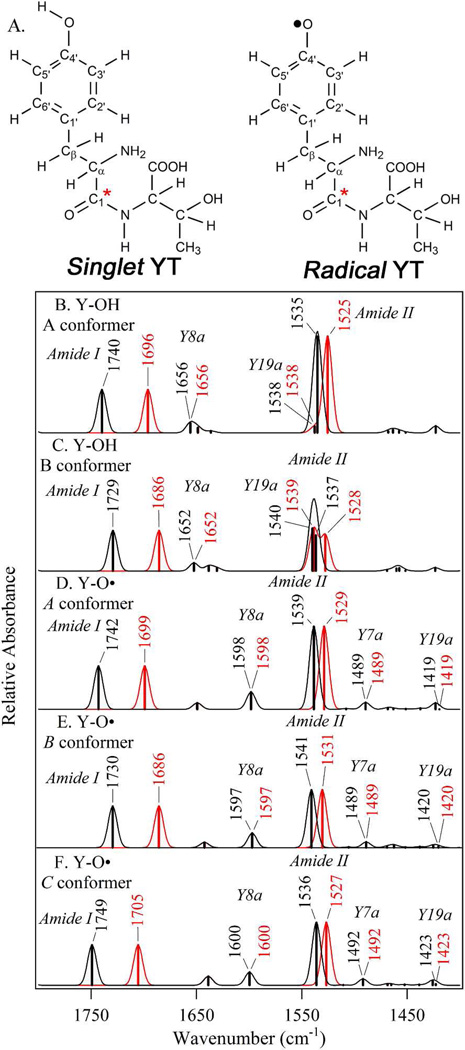
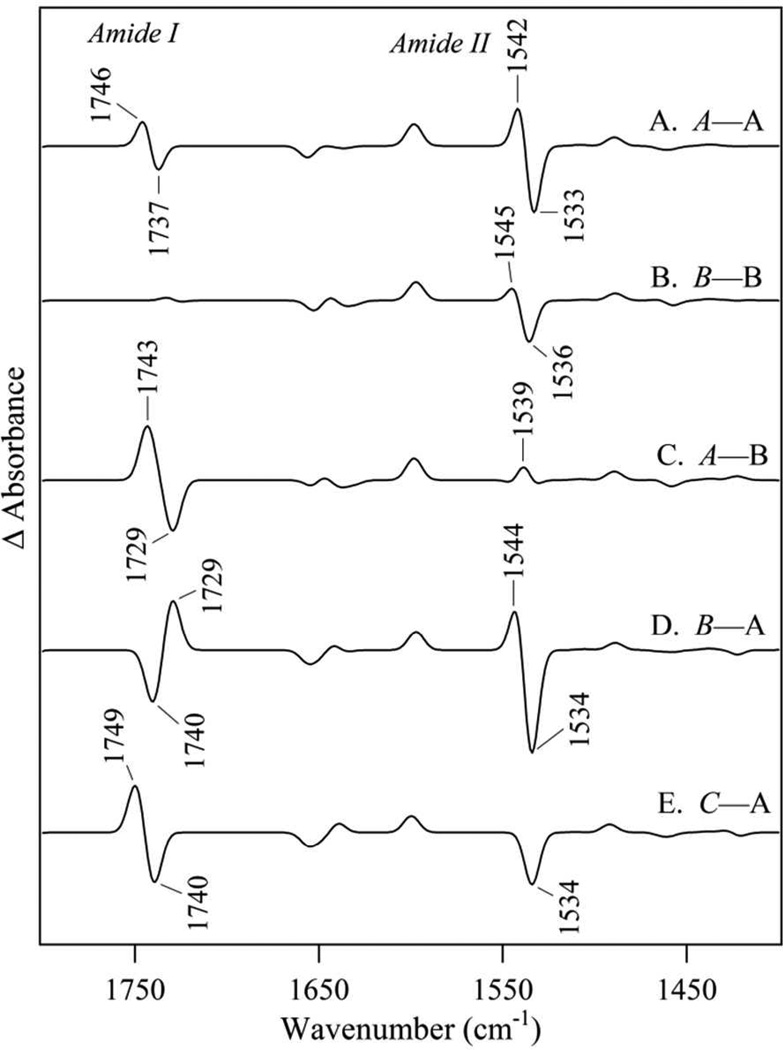
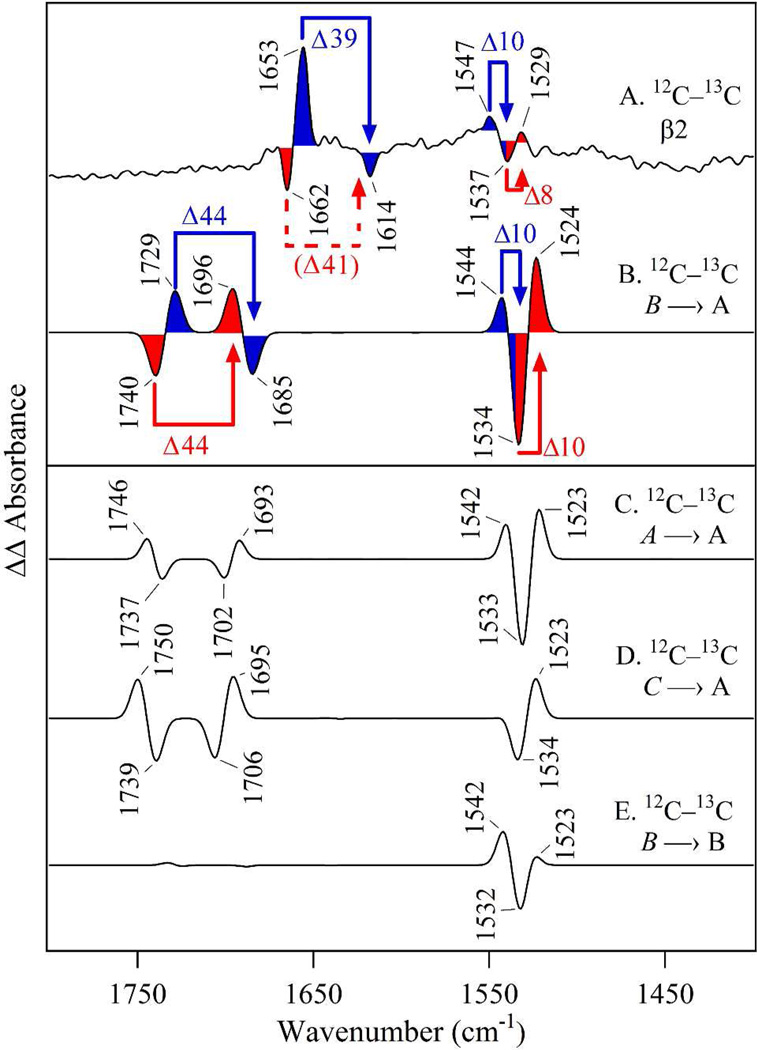
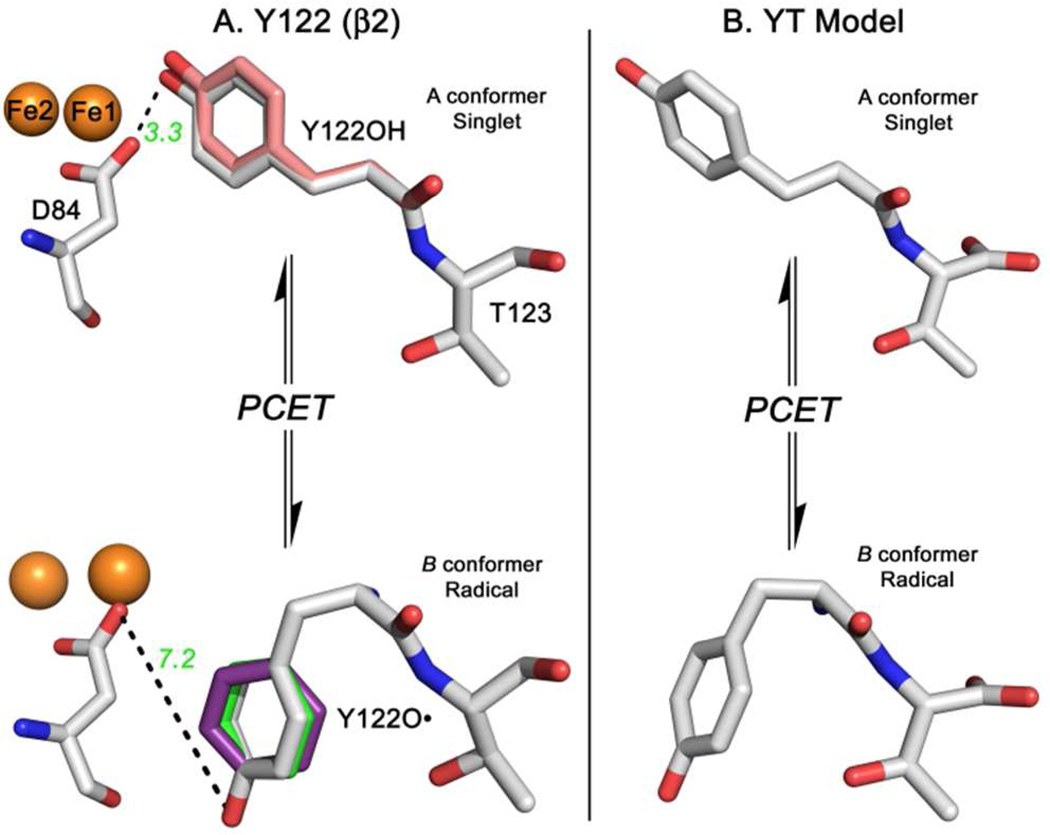
Tyrosyl radicals play essential roles in biological proton-coupled electron transfer (PCET) reactions. Ribonucleotide reductase (RNR) catalyzes the reduction of ribonucleotides and is vital in DNA replication in all organisms. Class Ia RNRs consist of α2 and β2 homodimeric subunits. In class Ia RNR, such as the E. coli enzyme, an essential tyrosyl radical (Y122O(•))-diferric cofactor is located in β2. Although Y122O(•) is extremely stable in free β2, Y122O(•) is highly reactive in the quaternary substrate-α2β2 complex and serves as a radical initiator in catalytic PCET between β2 and α2. In this report, we investigate the structural interactions that control the reactivity of Y122O(•) in a model system, isolated E. coli β2. Y122O(•) was reduced with hydroxyurea (HU), a radical scavenger that quenches the radical in a clinically relevant reaction. In the difference FT-IR spectrum, associated with this PCET reaction, amide I (CO) and amide II (CN/NH) bands were observed. Specific (13)C-labeling of the tyrosine C1 carbon assigned a component of these bands to the Y122-T123 amide bond. Comparison to density functional calculations on a model dipeptide, tyrosine-threonine, and structural modeling demonstrated that PCET is associated with a Y122 rotation and a 7.2 Å translation of the Y122 phenolic oxygen. To test for the functional consequences of this structural change, a proton inventory defined the origin of the large solvent isotope effect (SIE = 16.7 ± 1.0 at 25 °C) on this reaction. These data suggest that the one-electron, HU-mediated reduction of Y122O(•) is associated with two, rate-limiting (full or partial) proton transfer reactions. One is attributable to HU oxidation (SIE = 11.9, net H atom transfer), and the other is attributable to coupled, hydrogen-bonding changes in the Y122O(•)-diferric cofactor (SIE = 1.4). These results illustrate the importance of redox-linked changes to backbone and ring dihedral angles in high potential PCET and provide evidence for rate-limiting, redox-linked hydrogen-bonding interactions between Y122O(•) and the iron cluster.
Figures
Similar articles
-
A Proton Wire Mediates Proton Coupled Electron Transfer from Hydroxyurea and Other Hydroxamic Acids to Tyrosyl Radical in Class Ia Ribonucleotide Reductase.J Phys Chem B. 2020 Jan 16;124(2):345-354. doi: 10.1021/acs.jpcb.9b08587. Epub 2020 Jan 6. J Phys Chem B. 2020. PMID: 31904962
-
Redox-dependent structural coupling between the α2 and β2 subunits in E. coli ribonucleotide reductase.J Phys Chem B. 2014 Mar 20;118(11):2993-3004. doi: 10.1021/jp501121d. Epub 2014 Mar 7. J Phys Chem B. 2014. PMID: 24606240
-
Redox-linked changes to the hydrogen-bonding network of ribonucleotide reductase β2.J Am Chem Soc. 2013 May 1;135(17):6380-3. doi: 10.1021/ja3032949. Epub 2013 Apr 17. J Am Chem Soc. 2013. PMID: 23594029 Free PMC article.
-
Reaction dynamics and proton coupled electron transfer: studies of tyrosine-based charge transfer in natural and biomimetic systems.Biochim Biophys Acta. 2015 Jan;1847(1):46-54. doi: 10.1016/j.bbabio.2014.09.003. Epub 2014 Sep 28. Biochim Biophys Acta. 2015. PMID: 25260243 Review.
-
Long-range proton-coupled electron transfer in the Escherichia coli class Ia ribonucleotide reductase.Essays Biochem. 2017 May 9;61(2):281-292. doi: 10.1042/EBC20160072. Print 2017 May 9. Essays Biochem. 2017. PMID: 28487404 Review.
Cited by
-
Could tyrosine and tryptophan serve multiple roles in biological redox processes?Philos Trans A Math Phys Eng Sci. 2015 Mar 13;373(2037):20140178. doi: 10.1098/rsta.2014.0178. Philos Trans A Math Phys Eng Sci. 2015. PMID: 25666062 Free PMC article.
-
Thermally Induced Oxidation of [FeII(tacn)2](OTf)2 (tacn = 1,4,7-triazacyclononane).Eur J Inorg Chem. 2017 Dec 15;2017(46):5529-5535. doi: 10.1002/ejic.201701190. Epub 2017 Nov 9. Eur J Inorg Chem. 2017. PMID: 30416372 Free PMC article.
-
Structure of a ribonucleotide reductase R2 protein radical.Science. 2023 Oct 6;382(6666):109-113. doi: 10.1126/science.adh8160. Epub 2023 Oct 5. Science. 2023. PMID: 37797025 Free PMC article.
-
Biochemistry and theory of proton-coupled electron transfer.Chem Rev. 2014 Apr 9;114(7):3381-465. doi: 10.1021/cr4006654. Epub 2014 Apr 1. Chem Rev. 2014. PMID: 24684625 Free PMC article. Review. No abstract available.
-
Conformational control over proton-coupled electron transfer in metalloenzymes.Nat Rev Chem. 2024 Oct;8(10):762-775. doi: 10.1038/s41570-024-00646-7. Epub 2024 Sep 2. Nat Rev Chem. 2024. PMID: 39223400 Free PMC article. Review.
References
-
- Stubbe J, van der Donk WA. Protein Radicals in Enzyme Catalysis. Chem. Rev. 1998;98:705–762. - PubMed
-
- Dixon WT, Murphy D. Determination of the Acidity Constants of Some Phenol Radical Cations by Means of Electron Spin Resonance. J. Chem. Soc. Faraday Trans. 2. 1976;72:1221–1230.
-
- Sealy RC, Harman L, West PR, Mason RP. The Electron Spin Resonance Spectrum of the Tyrosyl Radical. J. Am. Chem. Soc. 1985;107:3401–3406.
Publication types
MeSH terms
Substances
Grants and funding
LinkOut - more resources
Full Text Sources
Other Literature Sources
