Identifying Mendelian disease genes with the variant effect scoring tool
- PMID: 23819870
- PMCID: PMC3665549
- DOI: 10.1186/1471-2164-14-S3-S3
Identifying Mendelian disease genes with the variant effect scoring tool
Abstract
Background: Whole exome sequencing studies identify hundreds to thousands of rare protein coding variants of ambiguous significance for human health. Computational tools are needed to accelerate the identification of specific variants and genes that contribute to human disease.
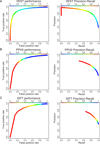
Results: We have developed the Variant Effect Scoring Tool (VEST), a supervised machine learning-based classifier, to prioritize rare missense variants with likely involvement in human disease. The VEST classifier training set comprised ~ 45,000 disease mutations from the latest Human Gene Mutation Database release and another ~45,000 high frequency (allele frequency >1%) putatively neutral missense variants from the Exome Sequencing Project. VEST outperforms some of the most popular methods for prioritizing missense variants in carefully designed holdout benchmarking experiments (VEST ROC AUC = 0.91, PolyPhen2 ROC AUC = 0.86, SIFT4.0 ROC AUC = 0.84). VEST estimates variant score p-values against a null distribution of VEST scores for neutral variants not included in the VEST training set. These p-values can be aggregated at the gene level across multiple disease exomes to rank genes for probable disease involvement. We tested the ability of an aggregate VEST gene score to identify candidate Mendelian disease genes, based on whole-exome sequencing of a small number of disease cases. We used whole-exome data for two Mendelian disorders for which the causal gene is known. Considering only genes that contained variants in all cases, the VEST gene score ranked dihydroorotate dehydrogenase (DHODH) number 2 of 2253 genes in four cases of Miller syndrome, and myosin-3 (MYH3) number 2 of 2313 genes in three cases of Freeman Sheldon syndrome.
Conclusions: Our results demonstrate the potential power gain of aggregating bioinformatics variant scores into gene-level scores and the general utility of bioinformatics in assisting the search for disease genes in large-scale exome sequencing studies. VEST is available as a stand-alone software package at http://wiki.chasmsoftware.org and is hosted by the CRAVAT web server at http://www.cravat.us.
Figures


Similar articles
-
REVEL: An Ensemble Method for Predicting the Pathogenicity of Rare Missense Variants.Am J Hum Genet. 2016 Oct 6;99(4):877-885. doi: 10.1016/j.ajhg.2016.08.016. Epub 2016 Sep 22. Am J Hum Genet. 2016. PMID: 27666373 Free PMC article.
-
A community-based resource for automatic exome variant-calling and annotation in Mendelian disorders.BMC Genomics. 2014;15 Suppl 3(Suppl 3):S5. doi: 10.1186/1471-2164-15-S3-S5. Epub 2014 May 6. BMC Genomics. 2014. PMID: 25078076 Free PMC article.
-
Exome-based mapping and variant prioritization for inherited Mendelian disorders.Am J Hum Genet. 2014 Mar 6;94(3):373-84. doi: 10.1016/j.ajhg.2014.01.016. Epub 2014 Feb 20. Am J Hum Genet. 2014. PMID: 24560519 Free PMC article.
-
[The application of exome sequencing in human disease].Yi Chuan. 2014 Nov;36(11):1077-86. Yi Chuan. 2014. PMID: 25567866 Review. Chinese.
-
Exome sequencing greatly expedites the progressive research of Mendelian diseases.Front Med. 2014 Mar;8(1):42-57. doi: 10.1007/s11684-014-0303-9. Epub 2014 Jan 3. Front Med. 2014. PMID: 24384736 Review.
Cited by
-
The first exome wide association study in Tunisia: identification of candidate loci and pathways with biological relevance for type 2 diabetes.Front Endocrinol (Lausanne). 2023 Dec 19;14:1293124. doi: 10.3389/fendo.2023.1293124. eCollection 2023. Front Endocrinol (Lausanne). 2023. PMID: 38192426 Free PMC article.
-
Statistically identifying tumor suppressors and oncogenes from pan-cancer genome-sequencing data.Bioinformatics. 2015 Nov 15;31(22):3561-8. doi: 10.1093/bioinformatics/btv430. Epub 2015 Jul 25. Bioinformatics. 2015. PMID: 26209800 Free PMC article.
-
Characterization of CYP2D6 Pharmacogenetic Variation in Sub-Saharan African Populations.Clin Pharmacol Ther. 2023 Mar;113(3):643-659. doi: 10.1002/cpt.2749. Epub 2022 Oct 21. Clin Pharmacol Ther. 2023. PMID: 36111505 Free PMC article.
-
Enhancing Missense Variant Pathogenicity Prediction with MissenseNet: Integrating Structural Insights and ShuffleNet-Based Deep Learning Techniques.Biomolecules. 2024 Sep 2;14(9):1105. doi: 10.3390/biom14091105. Biomolecules. 2024. PMID: 39334871 Free PMC article.
-
Targeted sequencing of the LRRTM gene family in suicide attempters with bipolar disorder.Am J Med Genet B Neuropsychiatr Genet. 2020 Mar;183(2):128-139. doi: 10.1002/ajmg.b.32767. Epub 2019 Dec 19. Am J Med Genet B Neuropsychiatr Genet. 2020. PMID: 31854516 Free PMC article.
References
-
- Kumar P, Henikoff S, Ng P. Predicting the effects of coding non-synonymous variants on protein function using the SIFT algorithm. Nature protocols. 2009;4(7):1073–1081. - PubMed
Publication types
MeSH terms
Grants and funding
LinkOut - more resources
Full Text Sources
Other Literature Sources
Medical

