

Analysis of NKp30/NCR3 isoforms in untreated HIV-1-infected patients from the ANRS SEROCO cohort
- PMID: 23802087
- PMCID: PMC3661172
- DOI: 10.4161/onci.23472
Analysis of NKp30/NCR3 isoforms in untreated HIV-1-infected patients from the ANRS SEROCO cohort
Abstract
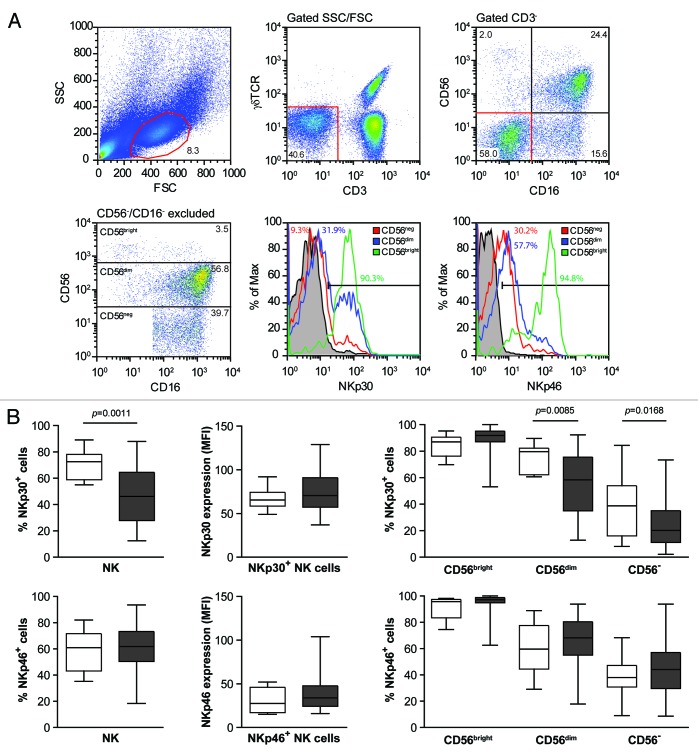
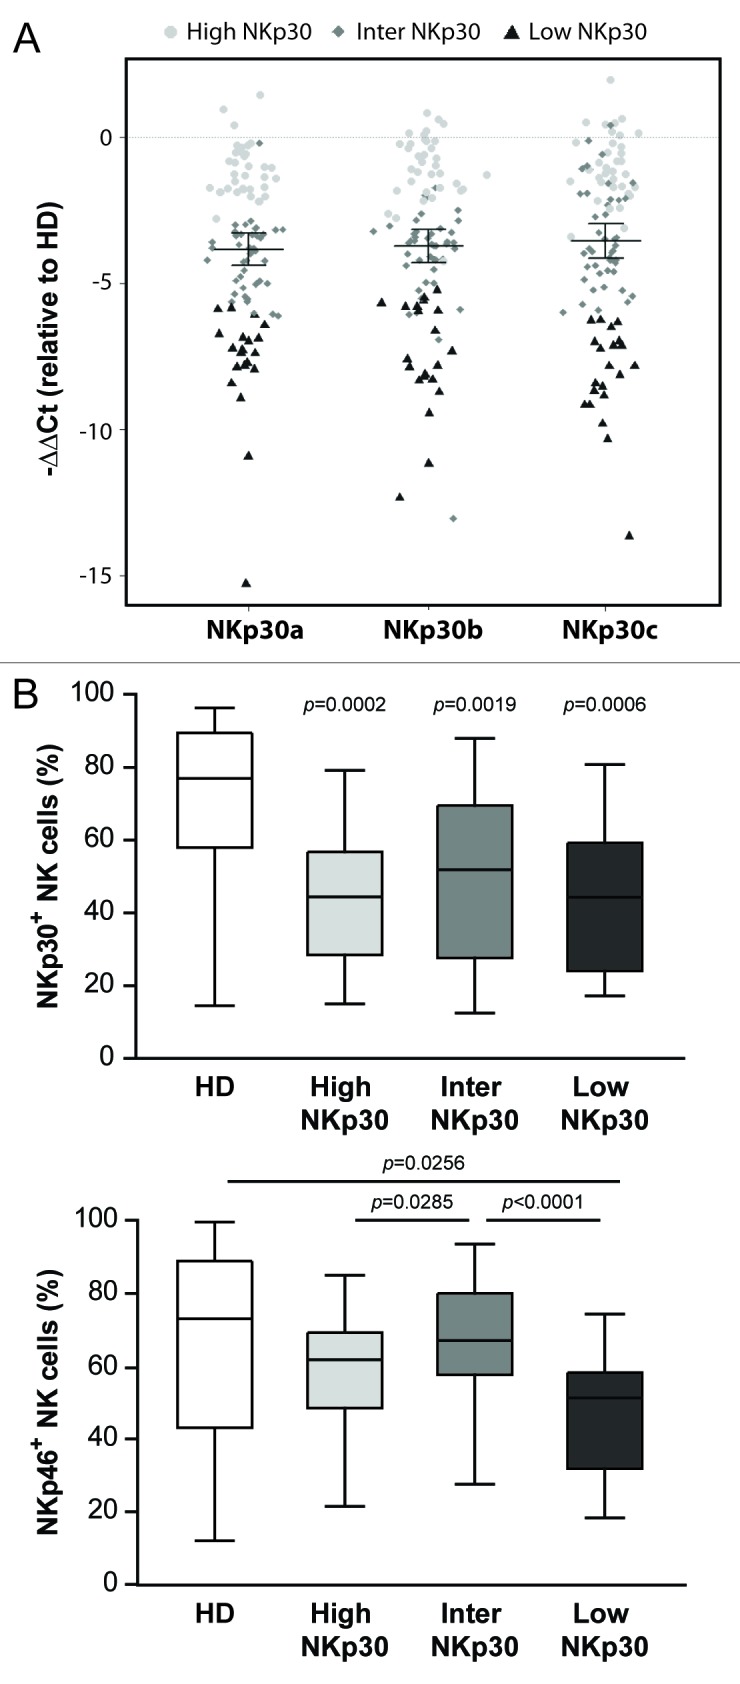
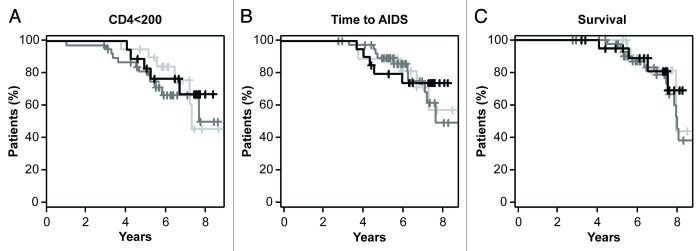
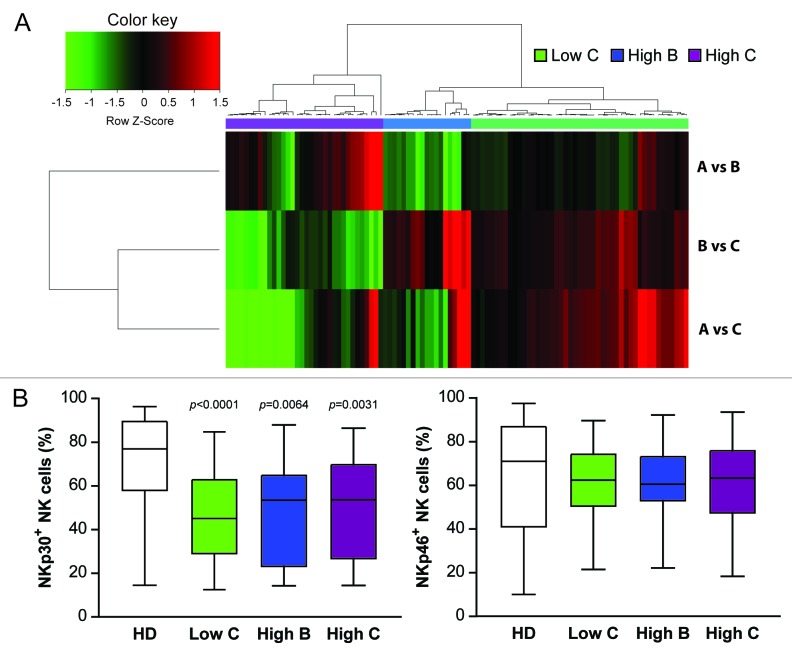
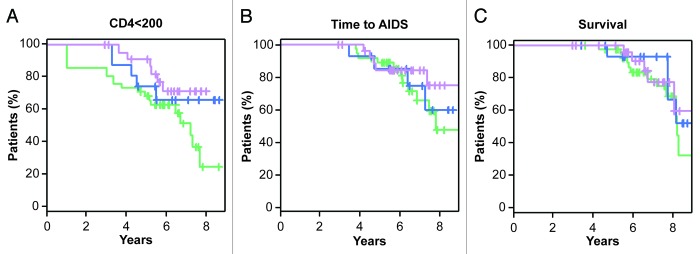
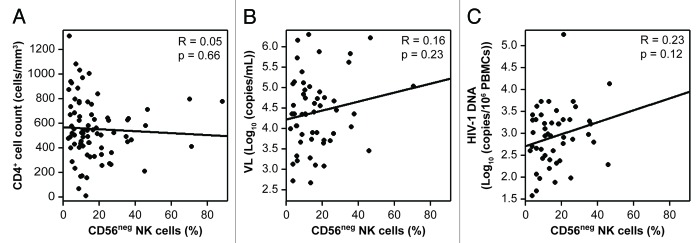
Natural killer (NK) cells play a prominent role at the intersection between innate and cognate immunity, thus influencing the development of multiple pathological conditions including HIV-1-induced AIDS. Not only NK cells directly kill HIV-1-infected cells, but also control the maturation and/or elimination of dendritic cells (DCs). These functions are regulated by the delicate balance between activating and inhibiting receptors expressed at the NK-cell surface. Among the former, NKp30 has raised significant interest since the alternative splicing of its intracellular domain leads to differential effector functions, dictating the prognosis of patients bearing gastrointestinal sarcoma, and B7-H6 has recently been identified as its main ligand. Since NKp30 is downregulated in CD56-/CD16+ NK cells expanded in viremic, chronically infected HIV-1+ patients, we decided to investigate the predictive value of NKp30 splice variants for spontaneous disease progression in 89 therapy-naïve HIV-1-infected individuals enrolled in an historical cohort of patients followed since diagnosis (ANRS SEROCO cohort). We found no difference in the representation of NK-cell subsets (CD56bright, CD56dim, CD56neg) in HIV-1-infected patients as compared with healthy subjects. NKp30 downregulation was detected in CD56dim and CD56neg NK-cell subsets, yet this did not convey any prognostic value. None of the NKp30 isoforms did affect disease progression, as measured in terms of time-to-loss of circulating CD4+ T cells, time-to-AIDS-defining events and overall survival. NKp30 isoforms do not seem to play a major role in the outcome of HIV-1 infection, but the heterogeneity of the immuno-virological status of patients at enrollment could have to be taken into account.
Keywords: HIV-1; NK; NKp30 isoforms; immunosurveillance; natural course of infection.
Figures
Similar articles
-
B7-H6-mediated downregulation of NKp30 in natural killer cells contributes to HIV-2 immune escape.AIDS. 2019 Jan 27;33(1):23-32. doi: 10.1097/QAD.0000000000002061. AIDS. 2019. PMID: 30325780
-
Increased CD56(bright) NK cells in HIV-HCV co-infection and HCV mono-infection are associated with distinctive alterations of their phenotype.Virol J. 2016 Apr 18;13:67. doi: 10.1186/s12985-016-0507-5. Virol J. 2016. PMID: 27091211 Free PMC article.
-
Distinct natural killer cells in HIV-exposed seronegative subjects with effector cytotoxic CD56(dim) and CD56(bright) cells and memory-like CD57⁺NKG2C⁺CD56(dim) cells.J Acquir Immune Defic Syndr. 2014 Dec 15;67(5):463-71. doi: 10.1097/QAI.0000000000000350. J Acquir Immune Defic Syndr. 2014. PMID: 25230289
-
CD56bright NK IL-7Rα expression negatively associates with HCV level, and IL-7-induced NK function is impaired during HCV and HIV infections.J Leukoc Biol. 2017 Jul;102(1):171-184. doi: 10.1189/jlb.5A1116-456R. Epub 2017 Apr 11. J Leukoc Biol. 2017. PMID: 28400540 Free PMC article.
-
Role of chemokines in the biology of natural killer cells.Curr Top Microbiol Immunol. 2010;341:37-58. doi: 10.1007/82_2010_20. Curr Top Microbiol Immunol. 2010. PMID: 20369317 Review.
Cited by
-
Poorly cytotoxic terminally differentiated CD56negCD16pos NK cells accumulate in Kenyan children with Burkitt lymphomas.Blood Adv. 2018 May 22;2(10):1101-1114. doi: 10.1182/bloodadvances.2017015404. Blood Adv. 2018. PMID: 29764843 Free PMC article.
-
Regulation of the Functions of Natural Cytotoxicity Receptors by Interactions with Diverse Ligands and Alterations in Splice Variant Expression.Front Immunol. 2017 Mar 30;8:369. doi: 10.3389/fimmu.2017.00369. eCollection 2017. Front Immunol. 2017. PMID: 28424697 Free PMC article. Review.
-
Functional capacity of natural killer cells in HTLV-1 associated myelopathy/tropical spastic paraparesis (HAM/TSP) patients.BMC Infect Dis. 2019 May 17;19(1):433. doi: 10.1186/s12879-019-4032-1. BMC Infect Dis. 2019. PMID: 31101076 Free PMC article.
-
Natural killer cell mediated immunosurveillance of pediatric neuroblastoma.Oncoimmunology. 2015 May 5;4(11):e1042202. doi: 10.1080/2162402X.2015.1042202. eCollection 2015 Nov. Oncoimmunology. 2015. PMID: 26451315 Free PMC article.
-
First Trimester Pregnancy Loss and the Expression of Alternatively Spliced NKp30 Isoforms in Maternal Blood and Placental Tissue.Front Immunol. 2015 Jun 1;6:189. doi: 10.3389/fimmu.2015.00189. eCollection 2015. Front Immunol. 2015. PMID: 26082773 Free PMC article.
References
Publication types
LinkOut - more resources
Full Text Sources
Other Literature Sources
Research Materials