. 2013 Oct;64(1):272-85.
doi: 10.1016/j.cyto.2013.05.026. Epub 2013 Jun 21.

Improving the spectral analysis of Fluorescence Resonance Energy Transfer in live cells: application to interferon receptors and Janus kinases

Affiliations

Improving the spectral analysis of Fluorescence Resonance Energy Transfer in live cells: application to interferon receptors and Janus kinases

Christopher D Krause et al. Cytokine. 2013 Oct.

Abstract

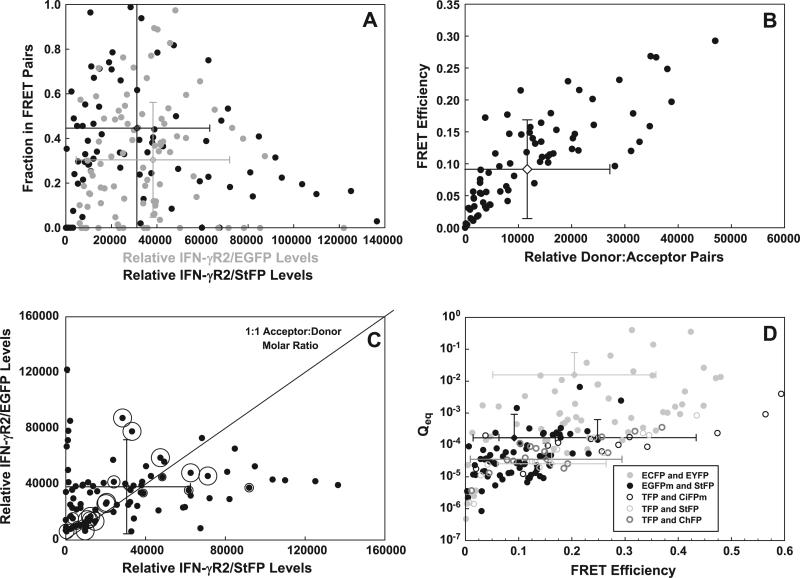
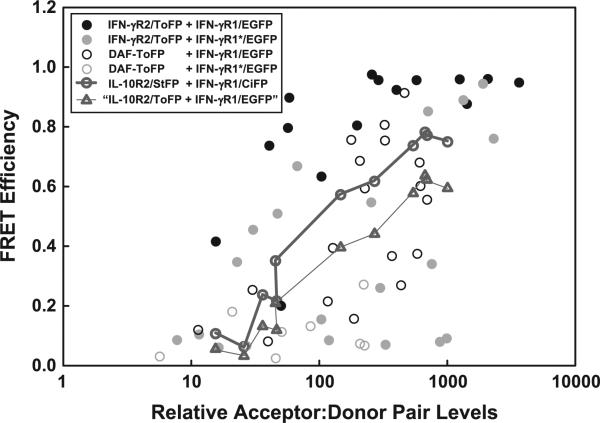
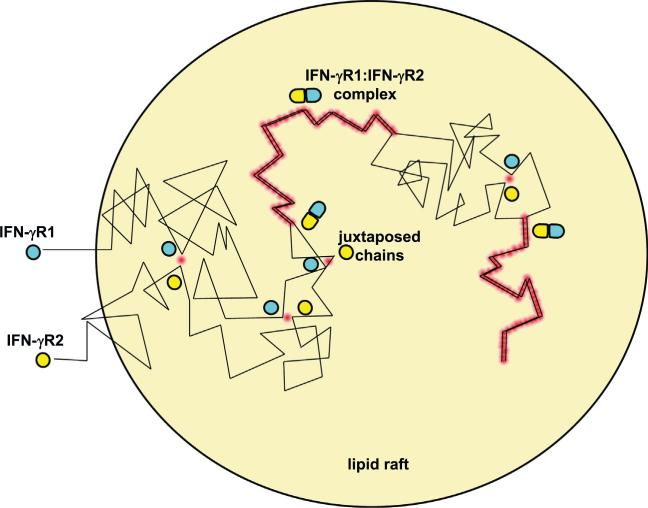
The observed Fluorescence Resonance Energy Transfer (FRET) between fluorescently labeled proteins varies in cells. To understand how this variation affects our interpretation of how proteins interact in cells, we developed a protocol that mathematically separates donor-independent and donor-dependent excitations of acceptor, determines the electromagnetic interaction of donors and acceptors, and quantifies the efficiency of the interaction of donors and acceptors. By analyzing large populations of cells, we found that misbalanced or insufficient expression of acceptor or donor as well as their inefficient or reversible interaction influenced FRET efficiency in vivo. Use of red-shifted donors and acceptors gave spectra with less endogenous fluorescence but produced lower FRET efficiency, possibly caused by reduced quenching of red-shifted fluorophores in cells. Additionally, cryptic interactions between jellyfish FPs artefactually increased the apparent FRET efficiency. Our protocol can distinguish specific and nonspecific protein interactions even within highly constrained environments as plasma membranes. Overall, accurate FRET estimations in cells or within complex environments can be obtained by a combination of proper data analysis, study of sufficient numbers of cells, and use of properly empirically developed fluorescent proteins.

Keywords: CFS; ChFP; CiFP; EBFP; ECFP; EGFP; ESaFP; EYFP; Equilibrium; FL; FLAG epitope (DYKDDDD); FP; FRET; IFN; IFN-α; IFN-γ; Interferon; Janus kinase; OFP; ORF; PEI; Receptor; StFP; TFP; confocal fluorescence spectroscopy; enhanced Sapphire fluorescent protein; enhanced blue fluorescent protein; enhanced cyan fluorescent protein; enhanced green fluorescent protein; enhanced yellow fluorescent protein; fluorescence resonance energy transfer; fluorescent protein; interferon; interferon-α; interferon-γ; mCherry/cherry fluorescent protein; mCitrine/monomeric citrine fluorescent protein; mOrange/orange fluorescent protein; mStrawberry/strawberry fluorescent protein; mTeal/teal fluorescent protein; open reading frame; polyethyleneimine.


Figures

Fig. 1
Fig. 1
Variation of FRET between IFN-γR1 and IFN-γR2. 293T cells were transfected with the tandem vector CMVγR2EYFP+EF3γR1ECFP, and were excited with both the 488 nm laser to preferentially excite EYFP and with the 442 nm laser to preferentially excite ECFP. Black circles are FRET values derived from cells transfected by Superfect; gray circles are FRET values obtained from cells transfected with DDAB:DOPE liposomes. (A) The FRET efficiency of each cell in the population is plotted as a function of relative IFN-γR2/EYFP levels. (B) The FRET efficiency of the above populations is plotted as a function of relative IFN-γR1/ECFP levels. Shaded regions in (A) and (B) outline cells exhibiting unusually high FRET efficiency between IFN-γ receptor chains (See Supp. Text 5). Error bars in (A) and (B) indicate the mean and standard deviation of the relative protein levels (horizontal) and FRET efficiency (vertical) of the cells transfected with Superfect (black bars) and liposomes (gray bars).
Fig. 2
Fig. 2
FRET efficiency at various acceptor:donor ratios for various protein pairs. FRET efficiency and the ratio of ECFP-tagged protein and EYFP-tagged protein were calculated for various protein pairs. (A) 293T cells are transfected with CMVγR2EYFP+EF3γR1ECFP (same data from Figs. 1) using either Superfect (black circles) or DDAB:DOPE liposomes (gray circles). (B) COS-1 cells are transfected with CMVγR2ECFP+CMVγR2EYFP, either in the absence of cotransfected pEF3-IFN-γR1 (black circles) or in its presence (gray circles). (C) 293T cells are transfected with pc3-Jak2/ECFPm and pc3-IFN-γR2/EYFPm alone (black circles) or also with pEF3-IFN-γR1 (dark gray circles). The latter population was treated with 1000 U/mL IFN-γ for at least 5 min and more cells analyzed (light gray circles). (D) 293T cells were transfected with either EF3γR1ECFP+EF3γR1EYFP (black circles) or EF3γR1ECFPm+EF3γR1EYFPm (gray circles). The shaded regions in (A), (B) and (D) outline cells exhibiting unusually high FRET efficiency between IFN-γ receptor chains (See Supp. Text 5). The error bars are colored to match the color of its corresponding dataset.
Fig. 3
Fig. 3
FRET between IFN-γR2 chains using red-shifted GFP variants. Cells were transfected with the following tandem vectors: (A) CMVγR2EBFP+CMVγR2GFP (B) CMVγR2ECFP+CMγR2EYFP, (C) CMVγR2ECFPm+CMVγR2StFP, (D) CMVγR2EGFPm+CMVγR2StFP, (E) CMVγR2EYFPm+CMVγR2StFP. (top) One representative spectrum was deconvolved and the result shown. Black lines are the resultant spectra after background noise was removed. Gray lines denote the component of the total spectra attributable to endogenous fluorescence. Blue, green, cyan, yellow, or orange-red lines denote the amount of total observed fluorescence due to EBFP, EGFP, ECFP, EYFP, or StFP respectively. The purple line denotes the summation of fluorescence from the two FPs and endogenous fluorescence. (middle) Pie charts show the fraction of total fluorescence from the above spectra deriving from endogenous fluorescence (background), from donor or from acceptor. The filled colors correspond to the line colors in the spectra. (bottom) The data from at least twenty deconvolved spectra are shown, as FRET efficiency vs. relative levels of acceptors. The optimal FRET level in each population is shown in each plot with a horizontal line; the inferred inter-FP distance, assuming random orientation of fluorophores, is placed above each horizontal line. Simultaneous analysis of cells expressing IFN-γR2/EBFP and IFN-γR2/GFP with two lasers could not be done due to instrumental limitations at the time [5], so only the distribution of FRET efficiencies are displayed for that pair. Note that the spectra of endogenous fluorescence is noisy because we used raw data obtained with our machine as a reference spectrum for endogenous fluorescence in these analyses. (For interpretation of the references to color in this figure legend, the reader is referred to the web version of this article.)
Fig. 4
Fig. 4
FRET between various protein pairs tagged with donor:acceptor pairs that derive from different species. The following tandem vectors or pairs of plasmids were transfected into 293T cells and the spectra of fluorescent cells analyzed: (A) CMVγR2EGFPm+CMVγR2StFP (black circles), CMVγR2StFP+CMVγR2EGFPm (dark gray circles), or pc3-IFN-γR2/EGFPm and pc3-IFN-γR2/StFP (light gray circles), (B) pc3-IFN-γR1/CiFPm and pc3-IFN-γR2/StFP (unfilled and gray filled black circles), CMVγR2StFP+EF3γR1EGFPm (filled black circles), pc3-IFN-γR2/CiFPm and pEF3-IFN-γR1/TFP (unfilled gray circles), or pc3-IFN-γR2/OFP and pEF3-IFN-γR1/EGFPm (filled gray circles) (C) pEF3-IFN-γR1/EGFPm and pEF3-IFN-γR1/OFP (gray circles) or pEF3-IFN-γR1/EGFPm and pEF3-IFN-γR1/StFP (black circles), and (D) pc3-IL-10R2/OFP and pEF3-Tyk2/EGFPm (filled gray circles), pc3-IFN-γR2/StFP and pCMVi.5-Jak2/CiFPm (unfilled black circles), or pEF3-IFN-γR1/EGFPm and pc3-Jak1/StFPm (filled black circles). The ratio of acceptor-tagged protein to donor-tagged protein and the observed FRET efficiency were calculated and plotted for each pair. In (A) and (C) the error bars are colored to resemble the corresponding dataset. In (B) the black and gray filled error bars correspond to cells expressing pc3-IFN-γR1/CiFPm and pc3-IFN-γR2/StFP before (unfilled circles) and after (gray filled circles) IFN-γ treatment; the unfilled error bars are colored to match the colors of the other three datasets. In (D), the error bars are colored and filled to correspond to each dataset.
Fig. 5
Fig. 5
Reversibility and incomplete interactions between IFN-γR2/EGFPm and IFN-γR2/StFP. Pooled data from Fig. 4A was used. (A) The fraction of incorporation of either IFN-γR2/EGFPm (gray circles) or IFN-γR2/StFP (black circles) into IFN-γR2/EGFPm:IFN-γR2/StFP complexes was plotted as a function of relative levels of the respective chain. Error bars are color coded to match the respective datasets. (B) FRET efficiency was plotted as a function of the relative numbers of complexes of IFN-γR2/EGFP:IFN-γR2/StFP formed in each cell. The mean and standard deviation are shown for each dimension in this population. (C) The levels of IFN-γR2/EGFPm and IFN-γR2/StFP in each cell were plotted pairwise, and a bubble plot was overlaid where the diameter of the bubble (black-bordered circles) is proportional to the magnitude of Qeq. The black diagonal line denotes the locations on the graph where cells possessing equal levels of IFN-γR2/EGFP to IFN-γR2/StFP chains would lie. The mean and standard deviation are shown for the donor and acceptor in this population. (D) The Qeq for each cell was plotted as a function of the obtained FRET efficiency between two IFN-γR2 chains. Cells were transfected with IFN-γR2 tagged to either ECFP and EYFP (filled light gray circles), EGFP and StFP (filled black circles), TFP and CiFPm (unfilled black circles), TFP and StFP (unfilled light gray circles), or TFP and ChFP (unfilled dark gray circles). The error bars are color coded and filled to match its corresponding dataset.
Fig. 6
Fig. 6
Affinities of membrane localization or receptor interaction. FRET efficiency between the following pairs of fluorescent proteins excited at 488 nm was determined as a function of the numbers of donor:acceptor pairs measured: IFN-γR1/EGFP and IFN-γR2/ToFP (filled black circles), IFN-γR1[P284L]/EGFP and IFN-γR2/ToFP (filled gray circles), IFN-γR1/EGFP and DAF-ToFP (unfilled black circles), IFN-γR1[P284L]/EGFP and DAF-ToFP (unfilled gray circles), and IFN-γR1/CiFP and IL-10R2/StFP (unfilled thick dark gray circles, connected with the thick gray line segments). The data from filled circles come from a matched receptor pair, while the data from unfilled circles come from proteins that should not interact and therefore at most colocalize or nonspecifically interact. The data between IFN-γR1/CiFP and IL-10R2/StFP were translated to that predicted between EGFP and ToFP (unfilled thick dark gray triangles, connected with the thin gray line segments) to make all datasets more comparable.
Fig. 7
Fig. 7
FRET from colocalization and from direct biochemical interaction. A pair of proteins (shown here are IFN-γR1, in blue–green and IFN-γR2, in yellow) that are confined to a smaller areas will randomly collide with each other more frequently (black crooked lines denote their random migration). Each juxtaposition will result in a FRET event (red spot). Occasionally, the collided pair has the proper relative orientation, and interacts biochemically to form the receptor complex (blue–green and yellow flattened ellipses). The pair migrate together and persistently undergo FRET until the pair dissociates. Because the association is reversible, each receptor chain can associate with other receptor chains and form new complexes. However, to simplify the figure, the same two proteins are shown to re-associate. (For interpretation of the references to color in this figure legend, the reader is referred to the web version of this article.)

Similar articles

Cited by

References

    1. Bach EA, Aguet M, Schreiber RD. The IFNc receptor: a paradigm for cytokine receptor signaling. Annu Rev Immunol. 1997;15:563–91. - PubMed
    1. Pestka S, Kotenko SV, Muthukumaran G, Izotova LS, Cook JR, Garotta G. The interferon γ (IFN-γ) receptor: a paradigm for the multichain cytokine receptor. Cytokine Growth Factor Rev. 1997;8:189–206. - PubMed
    1. Pestka S, Krause CD, Walter MR. Interferons, interferon-like cytokines, and their receptors. Immunol Rev. 2004;202:8–32. - PubMed
    1. Langer JA, Cutrone EC, Kotenko S. The Class II cytokine receptor (CRF2) family: overview and patterns of receptor-ligand interactions. Cytokine Growth Factor Rev. 2004;15:33–48. - PubMed
    1. Krause CD, Mei E, Xie J, Jia Y, Bopp MA, Hochstrasser RM, et al. Seeing the light: preassembly and ligand-induced changes of the interferon γ receptor complex in cells. Mol Cell Proteomics. 2002;1:805–15. - PubMed

Publication types

MeSH terms

LinkOut - more resources