Inhibition of AMPK and Krebs cycle gene expression drives metabolic remodeling of Pten-deficient preneoplastic thyroid cells
- PMID: 23796563
- PMCID: PMC3766458
- DOI: 10.1158/0008-5472.CAN-13-1429
Inhibition of AMPK and Krebs cycle gene expression drives metabolic remodeling of Pten-deficient preneoplastic thyroid cells
Abstract
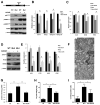
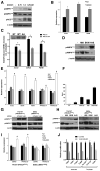
Rapidly proliferating and neoplastically transformed cells generate the energy required to support rapid cell division by increasing glycolysis and decreasing flux through the oxidative phosphorylation (OXPHOS) pathway, usually without alterations in mitochondrial function. In contrast, little is known of the metabolic alterations, if any, which occur in cells harboring mutations that prime their neoplastic transformation. To address this question, we used a Pten-deficient mouse model to examine thyroid cells where a mild hyperplasia progresses slowly to follicular thyroid carcinoma. Using this model, we report that constitutive phosphoinositide 3-kinase (PI3K) activation caused by PTEN deficiency in nontransformed thyrocytes results in a global downregulation of Krebs cycle and OXPHOS gene expression, defective mitochondria, reduced respiration, and an enhancement in compensatory glycolysis. We found that this process does not involve any of the pathways classically associated with the Warburg effect. Moreover, this process was independent of proliferation but contributed directly to thyroid hyperplasia. Our findings define a novel metabolic switch to glycolysis driven by PI3K-dependent AMPK inactivation with a consequent repression in the expression of key metabolic transcription regulators.
©2013 AACR.
Figures


Similar articles
-
Deletion of PTEN promotes tumorigenic signaling, resistance to anoikis, and altered response to chemotherapeutic agents in human mammary epithelial cells.Cancer Res. 2009 Nov 1;69(21):8275-83. doi: 10.1158/0008-5472.CAN-09-1067. Epub 2009 Oct 20. Cancer Res. 2009. PMID: 19843859 Free PMC article.
-
Antioxidant properties of mesalamine in colitis inhibit phosphoinositide 3-kinase signaling in progenitor cells.Inflamm Bowel Dis. 2013 Sep;19(10):2051-60. doi: 10.1097/MIB.0b013e318297d741. Inflamm Bowel Dis. 2013. PMID: 23867870 Free PMC article.
-
MicroRNA-146b promotes PI3K/AKT pathway hyperactivation and thyroid cancer progression by targeting PTEN.Oncogene. 2018 Jun;37(25):3369-3383. doi: 10.1038/s41388-017-0088-9. Epub 2018 Jan 22. Oncogene. 2018. PMID: 29353884
-
PI3K/AKT Pathway and Its Mediators in Thyroid Carcinomas.Mol Diagn Ther. 2016 Feb;20(1):13-26. doi: 10.1007/s40291-015-0175-y. Mol Diagn Ther. 2016. PMID: 26597586 Review.
-
Targeting the translational apparatus to improve leukemia therapy: roles of the PI3K/PTEN/Akt/mTOR pathway.Leukemia. 2011 Jul;25(7):1064-79. doi: 10.1038/leu.2011.46. Epub 2011 Mar 25. Leukemia. 2011. PMID: 21436840 Review.
Cited by
-
Starved and Asphyxiated: How Can CD8(+) T Cells within a Tumor Microenvironment Prevent Tumor Progression.Front Immunol. 2016 Feb 10;7:32. doi: 10.3389/fimmu.2016.00032. eCollection 2016. Front Immunol. 2016. PMID: 26904023 Free PMC article. Review.
-
Emerging roles of p53 and other tumour-suppressor genes in immune regulation.Nat Rev Immunol. 2016 Dec;16(12):741-750. doi: 10.1038/nri.2016.99. Epub 2016 Sep 26. Nat Rev Immunol. 2016. PMID: 27667712 Free PMC article. Review.
-
Fine-Tuning Lipid Metabolism by Targeting Mitochondria-Associated Acetyl-CoA-Carboxylase 2 in BRAFV600E Papillary Thyroid Carcinoma.Thyroid. 2021 Sep;31(9):1335-1358. doi: 10.1089/thy.2020.0311. Epub 2021 Mar 3. Thyroid. 2021. PMID: 33107403 Free PMC article.
-
Evaluation of the anti-tumor effects of lactate dehydrogenase inhibitor galloflavin in endometrial cancer cells.J Hematol Oncol. 2015 Jan 29;8:2. doi: 10.1186/s13045-014-0097-x. J Hematol Oncol. 2015. PMID: 25631326 Free PMC article.
-
The Tumor Suppressor PTEN as Molecular Switch Node Regulating Cell Metabolism and Autophagy: Implications in Immune System and Tumor Microenvironment.Cells. 2020 Jul 18;9(7):1725. doi: 10.3390/cells9071725. Cells. 2020. PMID: 32708484 Free PMC article. Review.
References
-
- Warburg O. On the origin of cancer cells. Science. 1956;123:309–14. - PubMed
-
- Ortega AD, Sanchez-Arago M, Giner-Sanchez D, Sanchez-Cenizo L, Willers I, Cuezva JM. Glucose avidity of carcinomas. Cancer letters. 2009;276:125–35. - PubMed
-
- Elstrom RL, Bauer DE, Buzzai M, Karnauskas R, Harris MH, Plas DR, et al. Akt stimulates aerobic glycolysis in cancer cells. Cancer research. 2004;64:3892–9. - PubMed
-
- Levine AJ, Puzio-Kuter AM. The control of the metabolic switch in cancers by oncogenes and tumor suppressor genes. Science. 2010;330:1340–4. - PubMed
Publication types
MeSH terms
Substances
Grants and funding
LinkOut - more resources
Full Text Sources
Other Literature Sources
Medical
Molecular Biology Databases
Research Materials

