. 2014 Jan;134(1):229-236.
doi: 10.1038/jid.2013.279. Epub 2013 Jun 21.

CD164 and FCRL3 are highly expressed on CD4+CD26- T cells in Sézary syndrome patients

Affiliations

CD164 and FCRL3 are highly expressed on CD4+CD26- T cells in Sézary syndrome patients

Maria Wysocka et al. J Invest Dermatol. 2014 Jan.

Abstract

Sézary syndrome (SS) cells express cell surface molecules also found on normal activated CD4 T cells. In an effort to find a more specific surface marker for malignant SS cells, a microarray analysis of gene expression was performed. Results showed significantly increased levels of mRNA for CD164, a sialomucin found on human CD34+ hematopoietic stem cells, and FCRL3, a molecule present on a subset of human natural T regulatory cells. Both markers were increased in CD4 T cells from SS patients compared with healthy donors (HD). Flow cytometry studies confirmed the increased expression of CD164 and FCRL3 primarily on CD4+CD26- T cells of SS patients. Importantly, a statistically significant correlation was found between an elevated percentage of CD4+CD164+ T cells and an elevated percentage of CD4+CD26- T cells in all tested SS patients but not in patients with mycosis fungoides and atopic dermatitis or HD. FCRL3 expression was significantly increased only in patients with high tumor burden. CD4+CD164+ cells displayed cerebriform morphology and their loss correlated with clinical improvement in treated patients. Our results suggest that CD164 can serve as a marker for diagnosis and for monitoring progression of cutaneous T-cell lymphoma (CTCL)/SS and that FCRL3 expression correlates with a high circulating tumor burden.


Figures
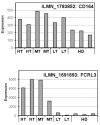
Figure 1
Figure 1. Increased mRNA expression of CD164 and FCLR3 genes in CD4 T cells from Sézary syndrome patients as assessed by microarray analysis
The expression of CD164 and FCRL3 in CD4 T cells isolated from PBMC of high (HT), medium (MT), low (LT) tumor burden Sézary patients and healthy donors (HD). Normalized signals with the indicated genes are shown.
Figure 2
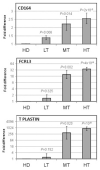
Figure 2. CD164, FCRL3 and T-plastin mRNA expression in CD4 T cells from Sézary syndrome patients as assessed by quantitative real-time RT-PCR
CD4 T cells were isolated from PBMC of 11 high tumor burden patients (≥ 50% malignant cells), 6 medium tumor burden patients (50-20% malignant cells), 10 low tumor burden patients (≤20% malignant cells) and 9 healthy donors. Total RNA was extracted from CD4 T cells followed by QRT-PCR to assess mRNA levels. Fold difference for CD164, FCRL3 and T Plastin is calculated versus expression levels in cells from healthy volunteers. Error bars represent standard error of mean.
Figure 3
Figure 3. The acquisition of CD164 correlates with the loss of CD26 on patients’ CD4 T cells; FCRL3 is predominantly expressed in CD4 T cells of high tumor burden patients
The cell surface expression of CD26, CD164 and FCRL3 was assessed by flow cytometry. (a) SS patients (n=59) demonstrate significantly higher percentages of CD4+CD164+ and CD4+CD26− T cells compared to MF patients (n=10), or HD (n=14). (b) Percentage of CD4+CD164+ T cells is significantly higher in high (HT; n=37), medium (MT; n=14) and low (LT; n=8) tumor burden patients compared to MF, HD or AD patients (n=6). (c) Percentage of CD4+FCRL3+ T cells is significantly higher only in CD4 T cells of HT patients (n=26) but not in MT (n=15) or LT (n=7) compared to HD. Results are expressed as mean with 95% CL (d) CD164 and FCRL3 are predominately expressed on CD4+CD26− and CD4+CD26-Vβ+ T cells. Shown results are from one representative patient (out of seven) with a TCRVβ defined by antibody (upper panel) and from one representative patient (out of fourteen) whose TCRVβ was not defined by antibody (lower panel). Patients’ PBMC were collected prior to initiation of systemic therapy at the University of Pennsylvania.
Figure 4
Figure 4. CD4+CD164+ demonstrate the phenotype of malignant Sézary cells
Assessment of cellular morphology, (a-b): CD4+CD164+ cells (5×10⁶, 85% purity) and CD4+CD164− cells (2.9×10⁶, purity 69%) from a high tumor burden patient were recovered using an anti-PE column. Cells were processed to obtain a 1 μm thick section, stained with H&E and assessed for the presence of malignant cells. Cellular morphology was examined using an Olympus BX51 microscope. Images were captured with a Leica DFC 420 camera. Data shown are from one representative patient out of five. Size assessment, (c-d): CD4 T cells from a high tumor burden patient were sorted into CD4+CD164+ and CD4+CD164− (purity of both populations 98%), placed on glass slides, air dried, stained with H&E and analyzed using a Zeiss Axiophot microscope. Images were captured using a Leica DFC 450 camera. Shown images are from one representative patient out of six. Bars =100 μm.
Figure 5
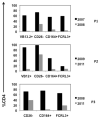
Figure 5. Clinical remission of disease correlates with the disappearance of CD4+CD26− T cells expressing Vβ, CD164 and FCRL3
PBMC from three high tumor burden patients were analyzed by multicolor flow cytometry to assess the expression of the molecules on CD3+/CD4+ T cells. Samples of patient’s PBMCs were collected prior to the onset of systemic treatment and during clinical remission. Patient 1 received ECP, IFN-α and PUVA whereas patient 2 and 3 received extracorporeal photopheresis (ECP), IFN-α and total skin electron beam therapy.

Similar articles

Cited by

References

    1. Bensussan A, Remtoula N, Sivori S, et al. Expression and function of the natural cytotoxicity receptor NKp46 on circulating malignant CD4+ T lymphocytes of Sezary syndrome patients. J Invest Dermatol. 2011;131:969–76. - PubMed
    1. Bernengo MG, Novelli M, Quaglino P, et al. The relevance of the CD4+ CD26− subset in the identification of circulating Sezary cells. Br J Dermatol. 2001;144:125–35. - PubMed
    1. Campbell JJ, Clark RA, Watanabe R, et al. Sezary syndrome and mycosis fungoides arise from distinct T-cell subsets: a biologic rationale for their distinct clinical behaviors. Blood. 2010;116:767–71. - PMC - PubMed
    1. Chung JS, Shiue LH, Duvic M, et al. Sezary syndrome cells overexpress syndecan-4 bearing distinct heparan sulfate moieties that suppress T-cell activation by binding DC-HIL and trapping TGF-beta on the cell surface. Blood. 2011;117:3382–90. - PMC - PubMed
    1. Clark RA, Shackelton JB, Watanabe R, et al. High-scatter T cells: a reliable biomarker for malignant T cells in cutaneous T-cell lymphoma. Blood. 2011;117:1966–76. - PMC - PubMed

Publication types

MeSH terms