

Duplication and population dynamics shape historic patterns of selection and genetic variation at the major histocompatibility complex in rodents
- PMID: 23789067
- PMCID: PMC3686191
- DOI: 10.1002/ece3.567
Duplication and population dynamics shape historic patterns of selection and genetic variation at the major histocompatibility complex in rodents
Abstract
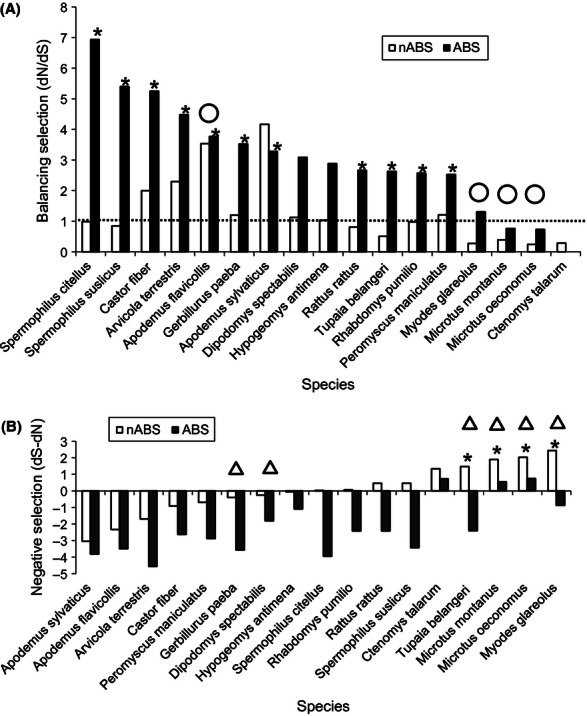
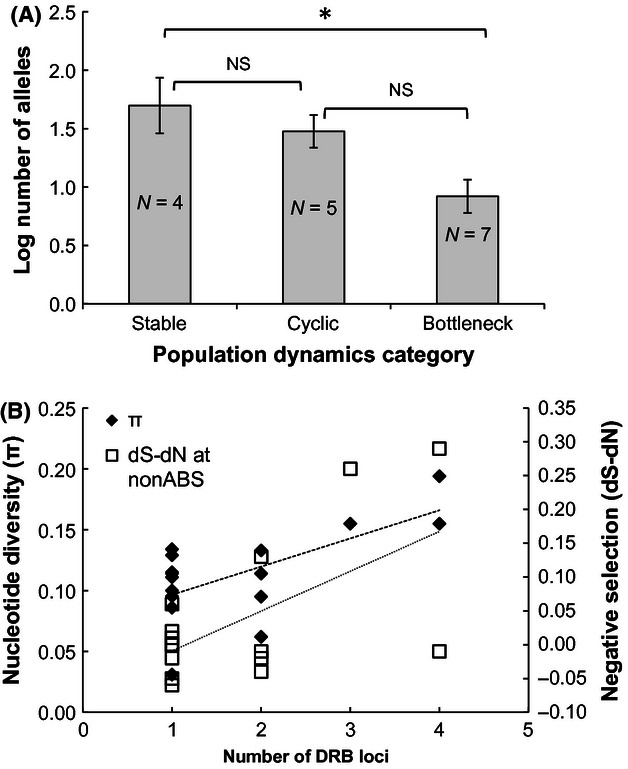
Genetic variation at the major histocompatibility complex (MHC) is vitally important for wildlife populations to respond to pathogen threats. As natural populations can fluctuate greatly in size, a key issue concerns how population cycles and bottlenecks that could reduce genetic diversity will influence MHC genes. Using 454 sequencing, we characterized genetic diversity at the DRB Class II locus in montane voles (Microtus montanus), a North American rodent that regularly undergoes high-amplitude fluctuations in population size. We tested for evidence of historic balancing selection, recombination, and gene duplication to identify mechanisms maintaining allelic diversity. Counter to our expectations, we found strong evidence of purifying selection acting on the DRB locus in montane voles. We speculate that the interplay between population fluctuations and gene duplication might be responsible for the weak evidence of historic balancing selection and strong evidence of purifying selection detected. To further explore this idea, we conducted a phylogenetically controlled comparative analysis across 16 rodent species with varying demographic histories and MHC duplication events (based on the maximum number of alleles detected per individual). On the basis of phylogenetic generalized linear model-averaging, we found evidence that the estimated number of duplicated loci was positively related to allelic diversity and, surprisingly, to the strength of purifying selection at the DRB locus. Our analyses also revealed that species that had undergone population bottlenecks had lower allelic richness than stable species. This study highlights the need to consider demographic history and genetic structure alongside patterns of natural selection to understand resulting patterns of genetic variation at the MHC.
Keywords: Balancing selection; Microtus montanus; gene duplication; major histocompatibility complex; population dynamics; purifying selection.
Figures
Similar articles
-
Evidence for selection maintaining MHC diversity in a rodent species despite strong density fluctuations.Immunogenetics. 2016 Jul;68(6-7):429-437. doi: 10.1007/s00251-016-0916-z. Epub 2016 May 25. Immunogenetics. 2016. PMID: 27225422
-
Gene duplication, allelic diversity, selection processes and adaptive value of MHC class II DRB genes of the bank vole, Clethrionomys glareolus.Immunogenetics. 2007 May;59(5):417-26. doi: 10.1007/s00251-007-0205-y. Epub 2007 Mar 10. Immunogenetics. 2007. PMID: 17351770
-
High polymorphism in MHC-DRB genes in golden snub-nosed monkeys reveals balancing selection in small, isolated populations.BMC Evol Biol. 2018 Mar 13;18(1):29. doi: 10.1186/s12862-018-1148-7. BMC Evol Biol. 2018. PMID: 29534675 Free PMC article.
-
Parasite-mediated selection of major histocompatibility complex variability in wild brandt's voles (Lasiopodomys brandtii) from Inner Mongolia, China.BMC Evol Biol. 2013 Jul 12;13:149. doi: 10.1186/1471-2148-13-149. BMC Evol Biol. 2013. PMID: 23848494 Free PMC article.
-
Allelic diversity and selection at the MHC class I and class II in a bottlenecked bird of prey, the White-tailed Eagle.BMC Evol Biol. 2019 Jan 5;19(1):2. doi: 10.1186/s12862-018-1338-3. BMC Evol Biol. 2019. PMID: 30611206 Free PMC article.
Cited by
-
Next-generation genotyping of hypervariable loci in many individuals of a non-model species: technical and theoretical implications.BMC Genomics. 2016 Mar 8;17:204. doi: 10.1186/s12864-016-2503-y. BMC Genomics. 2016. PMID: 26957424 Free PMC article.
-
Sexual selection explains more functional variation in the mammalian major histocompatibility complex than parasitism.Proc Biol Sci. 2013 Aug 21;280(1769):20131605. doi: 10.1098/rspb.2013.1605. Print 2013 Oct 22. Proc Biol Sci. 2013. PMID: 23966643 Free PMC article.
-
Drift, not selection, shapes toll-like receptor variation among oceanic island populations.Mol Ecol. 2015 Dec;24(23):5852-63. doi: 10.1111/mec.13437. Epub 2015 Nov 24. Mol Ecol. 2015. PMID: 26509790 Free PMC article.
-
Evidence for selection maintaining MHC diversity in a rodent species despite strong density fluctuations.Immunogenetics. 2016 Jul;68(6-7):429-437. doi: 10.1007/s00251-016-0916-z. Epub 2016 May 25. Immunogenetics. 2016. PMID: 27225422
-
MHC class II variation in a rare and ecological specialist mouse lemur reveals lower allelic richness and contrasting selection patterns compared to a generalist and widespread sympatric congener.Immunogenetics. 2015 Apr;67(4):229-45. doi: 10.1007/s00251-015-0827-4. Epub 2015 Feb 18. Immunogenetics. 2015. PMID: 25687337 Free PMC article.
References
-
- Aars J, Dallas JF, Piertney SB, Marshall F, Gow JL, Telfer S, et al. Widespread gene flow and high genetic variability in populations of water voles Arvicola terrestris in patchy habitats. Mol. Ecol. 2006;15:1455–1466. - PubMed
-
- Altizer S, Harvell D, Friedle E. Rapid evolutionary dynamics and disease threats to biodiversity. Trends Ecol. Evol. 2003;18:589–596.
-
- Apanius V, Penn D, Slev PR, Ruff LR, Potts WK. The nature of selection on the major histocompatibility complex. Crit. Rev. Immunol. 1997;17:179–224. - PubMed
-
- Axtner J, Sommer S. Gene duplication, allelic diversity, selection processes and adaptive value of mhc class ii drb genes of the bank vole, Clethrionomys glareolus. Immunogenetics. 2007;59:417–426. - PubMed
LinkOut - more resources
Full Text Sources
Other Literature Sources
Research Materials
