

Immune activation and regulation in simian immunodeficiency virus-Plasmodium fragile-coinfected rhesus macaques
- PMID: 23785209
- PMCID: PMC3754117
- DOI: 10.1128/JVI.00861-13
Immune activation and regulation in simian immunodeficiency virus-Plasmodium fragile-coinfected rhesus macaques
Erratum in
- J Virol. 2014 Nov;88(22):13516
Abstract
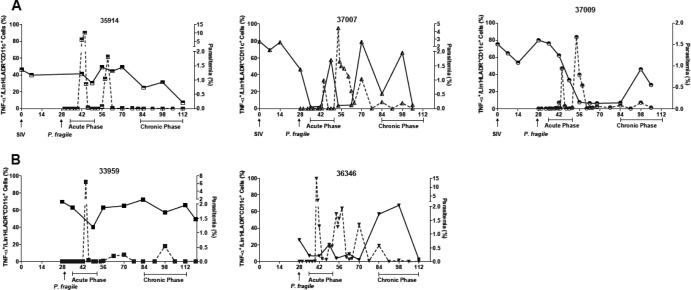
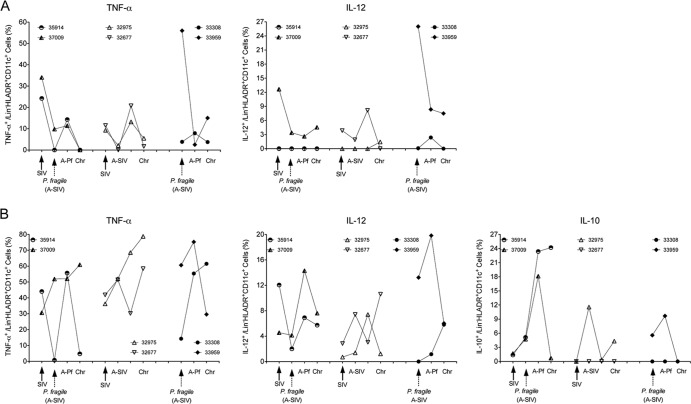
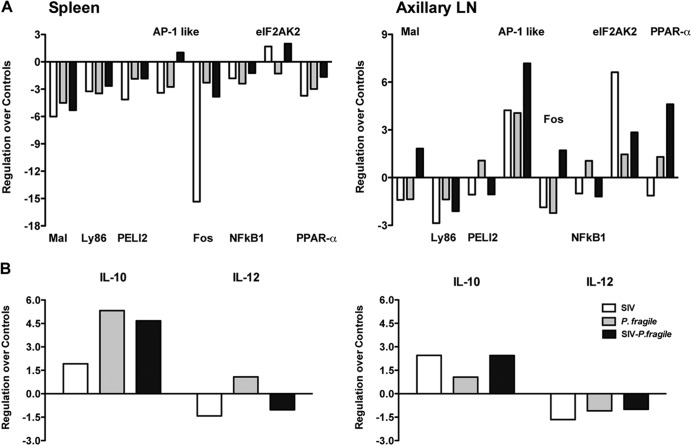
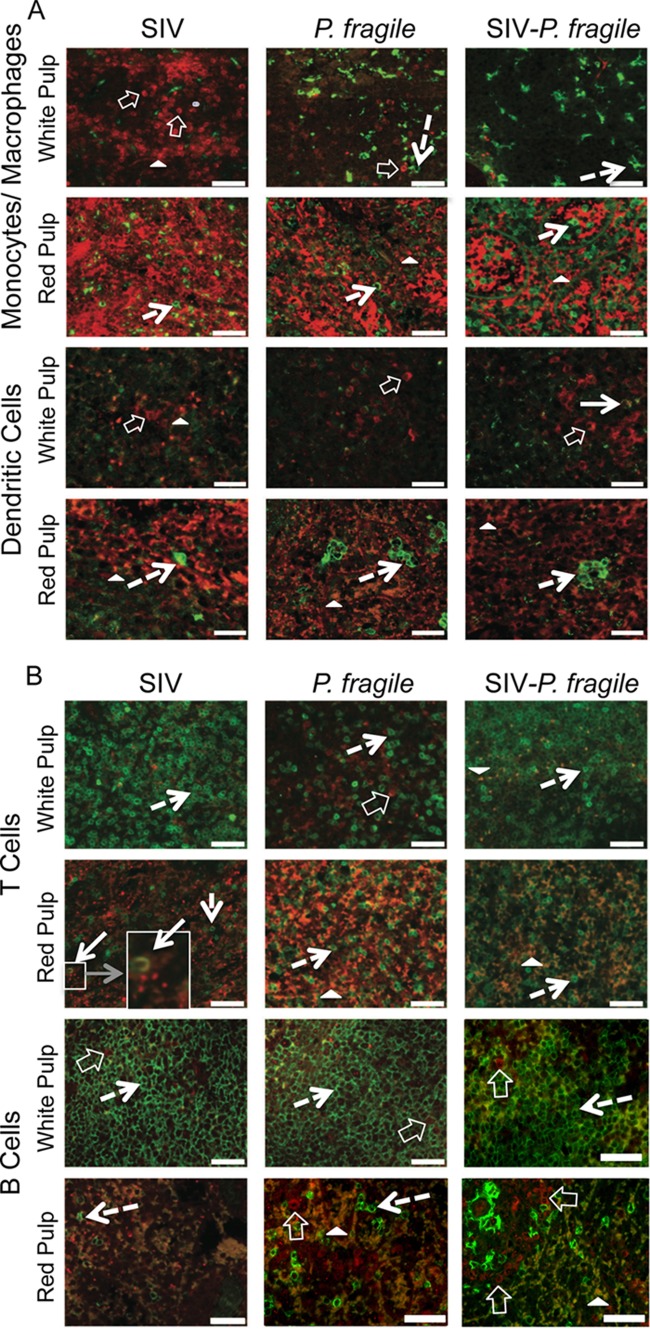
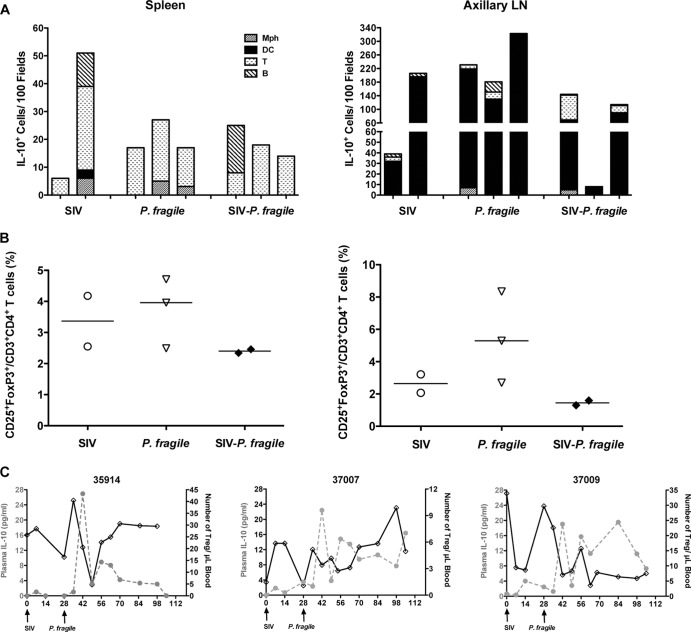
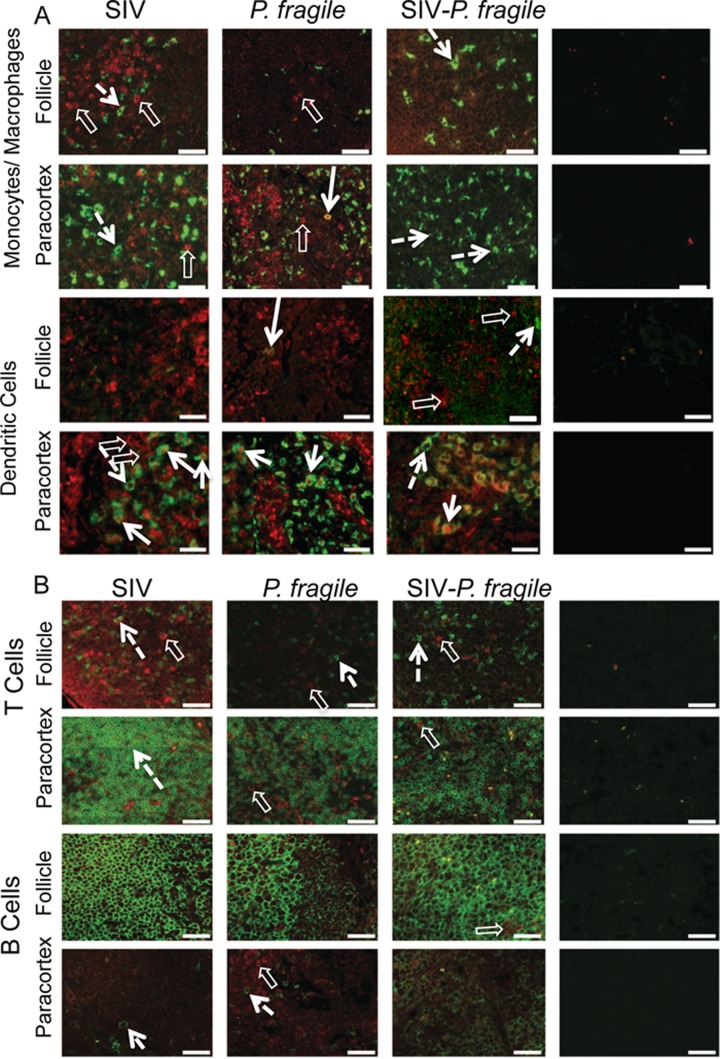
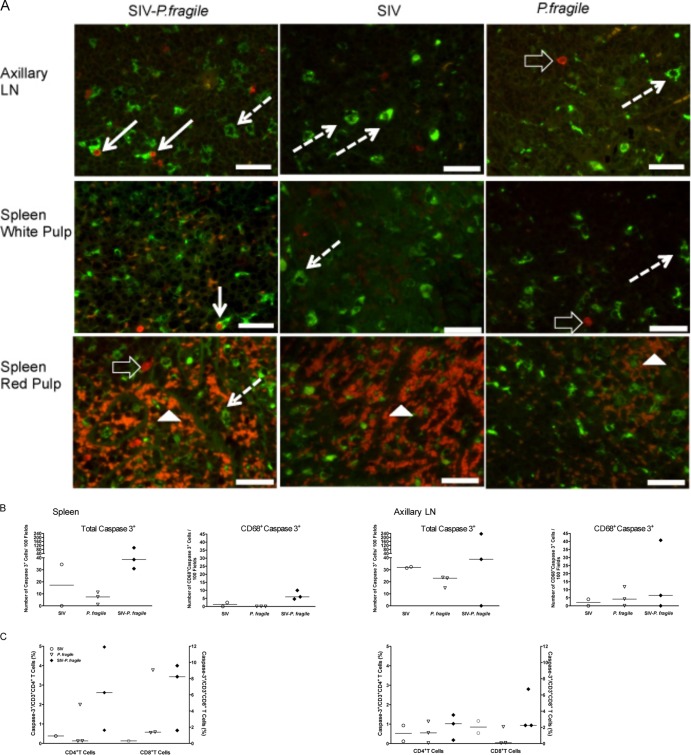
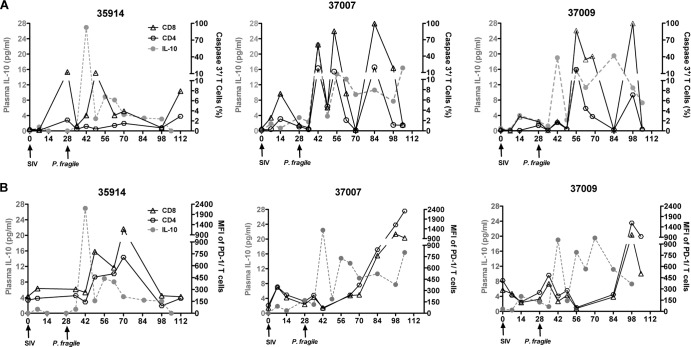
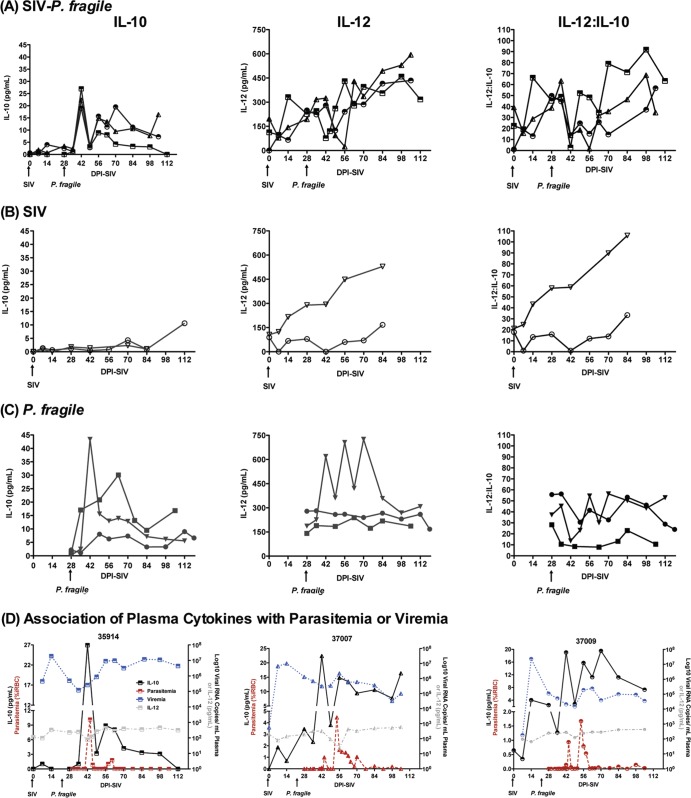
Human immunodeficiency virus (HIV) is characterized by immune activation, while chronic malaria is associated with elevated interleukin-10 (IL-10) levels. How these apparently antagonizing forces interact in the coinfected host is poorly understood. Using a rhesus macaque model of simian immunodeficiency virus (SIV)-Plasmodium fragile coinfection, we evaluated how innate immune effector cells affect the balance between immune activation and regulation. In vitro Toll-like receptor (TLR) responses of peripheral blood myeloid dendritic cells (mDC) and monocytes were temporarily associated with acute parasitemic episodes and elevated plasma IL-10 levels. Prolonged infection resulted in a decline of mDC function. Monocytes maintained TLR responsiveness but, in addition to IL-12 and tumor necrosis factor alpha, also produced IL-10. Consistent with the role of spleen in the clearance of parasite-infected red blood cells, coinfected animals also had increased splenic IL-10 mRNA levels. The main cellular source of IL-10 in the spleens of coinfected animals, however, was not splenic macrophages but T cells, suggesting an impairment of adaptive immunity. In contrast to those in spleen, IL-10-positive cells in axillary lymph nodes of coinfected animals were predominantly mDC, reminiscent of the immunosuppressive phenotype of peripheral blood mDC. Concurrent with IL-10 induction, however, SIV infection promoted elevated systemic IL-12 levels. The continuously increasing ratio of plasma IL-12 to IL-10 suggested that the overall host response in SIV-P. fragile-coinfected animals was shifted toward immune activation versus immune regulation. Therefore, SIV-P. fragile coinfection might be characterized by earlier manifestation of immune dysfunction and exhaustion than that of single-pathogen infections. This could translate into increased morbidity in HIV-malaria-coinfected individuals.
Figures
Similar articles
-
SIV infection aggravates malaria in a Chinese rhesus monkey coinfection model.BMC Infect Dis. 2019 Nov 12;19(1):965. doi: 10.1186/s12879-019-4465-6. BMC Infect Dis. 2019. PMID: 31718574 Free PMC article.
-
Evidence for an increased risk of transmission of simian immunodeficiency virus and malaria in a rhesus macaque coinfection model.J Virol. 2011 Nov;85(22):11655-63. doi: 10.1128/JVI.05644-11. Epub 2011 Sep 14. J Virol. 2011. PMID: 21917966 Free PMC article.
-
Virus-encoded TLR ligands reveal divergent functional responses of mononuclear phagocytes in pathogenic simian immunodeficiency virus infection.J Immunol. 2013 Mar 1;190(5):2188-98. doi: 10.4049/jimmunol.1201645. Epub 2013 Jan 21. J Immunol. 2013. PMID: 23338235 Free PMC article.
-
Sympathetic Nerves and Innate Immune System in the Spleen: Implications of Impairment in HIV-1 and Relevant Models.Cells. 2022 Feb 15;11(4):673. doi: 10.3390/cells11040673. Cells. 2022. PMID: 35203323 Free PMC article. Review.
-
Innate immunity to malaria-The role of monocytes.Immunol Rev. 2020 Jan;293(1):8-24. doi: 10.1111/imr.12830. Epub 2019 Dec 16. Immunol Rev. 2020. PMID: 31840836 Free PMC article. Review.
Cited by
-
SIV infection aggravates malaria in a Chinese rhesus monkey coinfection model.BMC Infect Dis. 2019 Nov 12;19(1):965. doi: 10.1186/s12879-019-4465-6. BMC Infect Dis. 2019. PMID: 31718574 Free PMC article.
-
Malaria and HIV coinfection in sub-Saharan Africa: prevalence, impact, and treatment strategies.Res Rep Trop Med. 2018 Jul 27;9:123-136. doi: 10.2147/RRTM.S154501. eCollection 2018. Res Rep Trop Med. 2018. PMID: 30100779 Free PMC article. Review.
-
Impairment of T cell function in parasitic infections.PLoS Negl Trop Dis. 2014 Feb 13;8(2):e2567. doi: 10.1371/journal.pntd.0002567. eCollection 2014 Feb. PLoS Negl Trop Dis. 2014. PMID: 24551250 Free PMC article. Review.
-
Aging, Health, and Quality of Life for Older People Living With HIV in Sub-Saharan Africa: A Review and Proposed Conceptual Framework.J Aging Health. 2019 Jan;31(1):109-138. doi: 10.1177/0898264317724549. Epub 2017 Aug 23. J Aging Health. 2019. PMID: 28831864 Free PMC article.
-
IL12Rβ1: the cytokine receptor that we used to know.Cytokine. 2015 Feb;71(2):348-59. doi: 10.1016/j.cyto.2014.11.018. Epub 2014 Dec 13. Cytokine. 2015. PMID: 25516297 Free PMC article. Review.
References
-
- French N, Nakiyingi J, Lugada E, Watera C, Whitworth JA, Gilks CF. 2001. Increasing rates of malarial fever with deteriorating immune status in HIV-1-infected Ugandan adults. AIDS 15:899–906 - PubMed
-
- Grimwade K, French N, Mbatha DD, Zungu DD, Dedicoat M, Gilks CF. 2004. HIV infection as a cofactor for severe falciparum malaria in adults living in a region of unstable malaria transmission in South Africa. AIDS 18:547–554 - PubMed
-
- Hoffman IF, Jere CS, Taylor TE, Munthali P, Dyer JR, Wirima JJ, Rogerson SJ, Kumwenda N, Eron JJ, Fiscus SA, Chakraborty H, Taha TE, Cohen MS, Molyneux ME. 1999. The effect of Plasmodium falciparum malaria on HIV-1 RNA blood plasma concentration. AIDS 13:487–494 - PubMed
-
- Kublin JG, Patnaik P, Jere CS, Miller WC, Hoffman IF, Chimbiya N, Pendame R, Taylor TE, Molyneux ME. 2005. Effect of Plasmodium falciparum malaria on concentration of HIV-1-RNA in the blood of adults in rural Malawi: a prospective cohort study. Lancet 365:233–240 - PubMed
Publication types
MeSH terms
Substances
Grants and funding
LinkOut - more resources
Full Text Sources
Other Literature Sources
Medical
