. 2013 Jun 24;201(7):1013-26.
doi: 10.1083/jcb.201211019. Epub 2013 Jun 17.

The spindle checkpoint, APC/C(Cdc20), and APC/C(Cdh1) play distinct roles in connecting mitosis to S phase

Affiliations

The spindle checkpoint, APC/C(Cdc20), and APC/C(Cdh1) play distinct roles in connecting mitosis to S phase

Linda Clijsters et al. J Cell Biol. .

Abstract

DNA replication depends on a preceding licensing event by Cdt1 and Cdc6. In animal cells, relicensing after S phase but before mitosis is prevented by the Cdt1 inhibitor geminin and mitotic cyclin activity. Here, we show that geminin, like cyclin B1 and securin, is a bona fide target of the spindle checkpoint and APC/C(Cdc20). Cyclin B1 and geminin are degraded simultaneously during metaphase, which directs Cdt1 accumulation on segregating sister chromatids. Subsequent activation of APC/C(Cdh1) leads to degradation of Cdc6 well before Cdt1 becomes unstable in a replication-coupled manner. In mitosis, the spindle checkpoint supports Cdt1 accumulation, which promotes S phase onset. We conclude that the spindle checkpoint, APC/C(Cdc20), and APC/C(Cdh1) act successively to ensure that the disappearance of licensing inhibitors coincides exactly with a peak of Cdt1 and Cdc6. Whereas cell cycle entry from quiescence requires Cdc6 resynthesis, our results indicate that proliferating cells use a window of time in mitosis, before Cdc6 is degraded, as an earlier opportunity to direct S phase.


Figures
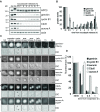
Figure 1.
Figure 1.
Geminin is degraded at the same time as cyclin B1. (A) Endogenous geminin is fully degraded at mitotic exit (also see Fig. S1 A). U2OS cells arrested in mitosis by nocodazole were collected by mitotic shake-off and released for the indicated hours. APC3 is highly phosphorylated in mitosis. Actin is used as a loading control. The data shown are a representative from at least three repeated experiments. (B) Relative protein levels of geminin, cyclin B1, Cdc6, and Aurora A are calculated and corrected for actin loading (data from three independent experiments; mean ± SEM). (C) Live U2OS cells expressing geminin-Cherry (panel 1), cyclin B1-Cherry (panel 2), securin-Venus (panel 3), Cdc6-Venus (panel 4), and Aurora A–ECFP (panel 5) were imaged by differential interference contrast (DIC, bottom) and fluorescence (top) microscopy. Still images of the indicated phases in mitosis are shown. Arrows point to the metaphase plate. Bars, 10 µm. (D) The intensity of fluorescence in U2OS cells expressing the different constructs was plotted against time after anaphase (geminin-Cherry and cyclin B1-Cherry, n = 4; securin-Venus and Aurora A–ECFP, n = 5; Cdc6-Venus, n = 11; mean ± SEM).
Figure 2.
Figure 2.
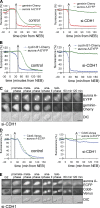
Destruction of geminin and Cdc6 requires different APC/C activators. (A and B) Live U2OS cells expressing Aurora A–EYFP and geminin-Cherry (A) or cyclin B1–Cherry (B) were imaged by DIC and fluorescence microscopy. Left, control; right, cotransfected with si-CDH1. The intensity of fluorescence was plotted against time after NEB. The start of anaphase (A) was indicated as detected by DIC microscopy. Data are from individual cells representative of three independent experiments. Control of single shRNA is shown in Fig. S2 A. (C) Still images of the cell in A cotransfected with si-CDH1. The different phases of mitosis are indicated. Minutes refer to time passed after anaphase onset. (D) Live U2OS cells expressing Cdc6-Venus and Aurora A–ECFP were imaged by DIC and fluorescence microscopy. Left, control; right, cotransfected with si-CDH1. The intensity of fluorescence was plotted against time after NEB. The start of anaphase (A) was indicated as observed by DIC microscopy. Data are from individual cells representative of three independent experiments. Control of single shRNA is in Fig. S2 B. (E) Still images of the cell in D cotransfected with si-CDH1. Different phases of mitosis are indicated, or minutes after anaphase onset. Nuclear Cdc6 levels start to decline at the last time point by an APC/C-independent pathway (not depicted). Bars, 10 µm.
Figure 3.
Figure 3.
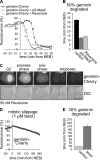
The spindle checkpoint stabilizes geminin. (A) U2OS cells stably expressing geminin-Cherry were transfected with pS-MAD2, treated with Mps1 inhibitor reversine or left untreated and imaged. The intensity of fluorescence was plotted against time after NEB. Data are from individual cells representative of three independent experiments. (B) The time from NEB until 50% of geminin was degraded was measured (control, n = 11; pS-MAD2, n = 13; reversine, n = 7; mean ± SEM). (C) U2OS cells stably expressing geminin-Cherry were imaged by DIC and fluorescence microscopy after 50 nM reversine treatment. Images of the indicated phases in mitosis are shown. Note that there is no metaphase plate and that cells divide in two. Bar, 10 µm. (D) Live U2OS cells stably expressing geminin-Cherry were imaged. The mean intensity of fluorescence in taxol-treated U2OS cells expressing geminin-Cherry was plotted against time after NEB (n = 10; mean ± SEM). The graph indicates the quantification until 240 min after NEB, when some cells started to slip out of mitosis. (E) The time from NEB until 30% of geminin was degraded was measured in taxol-treated and control cells (n = 10; mean ± SEM).
Figure 4.
Figure 4.
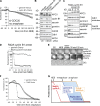
Increased licensing opportunity during mitotic exit. (A) The fluorescence intensity in live U2OS cells coexpressing cyclin B1–Cherry and geminin-Venus, cotransfected with si-CDC20 was plotted against time after NEB. Note that cells arrest in metaphase (n = 7; mean ± SEM). Controls are shown in Fig. S1 B and Fig. S2 C. (B) U2OS cells were treated with si-CDC20 or control RNAi. Mitotic cells were collected by mitotic shake-off and left untreated or treated for 2 h with Cdk1 inhibitor roscovitine. APC4 is used as loading control. The data shown are from a single representative experiment out of three repeats. (C) U2OS cells were transfected with R42A–cyclin B1–Cerulean, thymidine synchronized, and released for 14 h. After mitotic shake-off, cells were replated in fresh medium for indicated hours. APC/C–Cdc20 substrates, and not APC/C–Cdh1 substrates, were degraded in the nondegradable cyclin B1 arrest. Actin is used as a loading control. The data shown are from a single representative experiment out of three repeats. (D and E) The fluorescence intensity of geminin-Cherry and R42A–cyclin B1–Cerulean was plotted against time after NEB. Data are from an individual cell representative of three independent experiments (D). Images of the indicated phases in mitosis are shown E. Note that the cells did not exit mitosis but stayed arrested. Bar, 10 µm. (F) The intensity of fluorescence in live U2OS cells coexpressing geminin-Cherry and Cdc6-Venus was plotted against time from the beginning of anaphase. The fluorescence levels are relative to levels at NEB (n = 11, mean ± SEM). (G) A window of opportunity for DNA replication licensing is created by geminin destruction and closed again by Cdc6 destruction, before S phase.
Figure 5.
Figure 5.
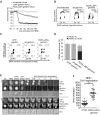
Concurrent degradation of geminin and cyclin B1 drives Cdt1 translocation. (A) U2OS cells were transiently transfected with the indicated plasmids. Each curve in the graph shows the average fluorescence intensity of multiple cells (wt-geminin-Venus, n = 4; L26A-geminin-Venus, n = 5; R23A,L26A-geminin-Venus, n = 4; mean ± SEM). (B) Asynchronous cells transfected with the indicated plasmids were, 48 h later, BrdU pulsed and processed for FACS analysis. Percentages of cells incorporating BrdU are indicated. The data shown are from a single representative experiment out of three repeats. (C) U2OS cells were transfected with the indicated plasmids and after overnight nocodazole treatment, processed for FACS analysis. Cells were stained for MPM2 (y-axis) and propidium iodide (x-axis). The numbers in the quadrants indicate the percentages of 4n-mitotic cells (top-right quadrant), G2 phase cells (bottom-right quadrant), G1 plus S phase cells (bottom-left quadrant), and 2n-mitotic cells (top-left quadrant). Values indicate mean percentages from two independent experiments. (D) The percentages of mitotic cells from C being either 4n or 2n, indicated as MUG, are represented in a bar graph (n = 2; mean ± SEM). (E) Live U2OS cells stably expressing both geminin-Cherry and Cdt1-Venus were imaged by DIC and fluorescence microscopy. Cdt1-Venus localization was used as a marker for preRC formation. Still images of control cells (panel 1) and cells wherein R23A,L26A-geminin-Cherry was expressed after RNAi-complementation (panel 2) are shown (for control see Fig. S3 C). The different phases of mitosis as observed by DIC microscopy are indicated. The arrows reveal the onset of Cdt1 chromosome localization in anaphase II as detected by reduced negative staining. Bars, 10 µm. (F) The start of Cdt1 degradation marks the start of DNA replication (see also Fig. S3 C). The time from NEB till Cdt1 degradation start is measured in live U2OS cells expressing Cdt1-Venus and wt-geminin-Cherry or R23A,L26A-geminin (control, n = 29; R23A,L26A-geminin, n = 25; mean ± SD; Mann-Whitney test; ***, P < 0.0001).
Figure 6.
Figure 6.
Geminin promotes Cdt1 accumulation in prometaphase. (A) Cdt1 is synthesized during prometaphase. Cdt1 levels in cells collected by gentle mitotic shake-off after nocodazole treatment were compared with those in G2 cells. Further protein synthesis of Cdt1 in mitosis is revealed after MG132 treatment of the nocodazole-blocked cells. Actin is used as loading control. The data shown are from a single representative experiment out of two repeats. (B) Top: U2OS cells were during thymidine release transfected with the indicated siRNAs, again thymidine synchronized, and arrested in mitosis by nocodazole treatment. Mitotic cells were collected by mitotic shake-off and released for 2 h after nocodazole wash-out or left untreated. Actin was used as loading control. Bottom: relative Cdt1, geminin, and Cdc6 protein levels in mitosis were corrected for loading and plotted. The graph indicates data from two independent experiments (mean ± SEM). (C) Mitotic cells with reduced geminin levels show no DNA damage signaling. U2OS cells were synchronized in mitosis as in B and compared with asynchronous geminin-depleted cells. Actin is used as loading control. Numbers indicate percentages of re-replicating cells (flow cytometry analysis of parallel samples is in Fig. S4 A). Note that a slight reduction of the Cdt1 signal in lane 4 correlates to the increased population of replicating cells. Replicating cells do not express Cdt1. (D) Geminin is limiting for Cdt1 accumulation. U2OS cells were stably transfected with geminin-Cherry and blotted for Cdt1. Numbers indicate relative Cdt1 levels. Asterisks indicate background bands.
Figure 7.
Figure 7.
The spindle checkpoint controls replication. (A) Live U2OS cells stably expressing both geminin-Cherry and Cdt1-Venus were imaged by DIC and fluorescence microscopy. Cells were treated with reversine or left untreated. Accumulation of Cdt1-Venus was measured from NEB until the start of geminin-Cherry degradation (control, n = 47; reversine, n = 38; mean ± SD; Mann-Whitney test; ***, P < 0.0001). (B) Asynchronous cells transfected with the indicated siRNAs were, 48 h later, pulsed with BrdU and processed for FACS analysis (left) and Western blot (right). Left: BrdU incorporation and propidium iodide staining were analyzed using flow cytometry. Values indicate percentages of cells in the different cell cycle phases. Right: actin was used as loading control. The data shown are from a single representative experiment out of two repeats. (C) G1-to-S phase transition was measured as the ratio S phase over G1 phase cells from two independent experiments (mean ± SEM). (D) Live U2OS cells expressing Cdt1-Venus were treated with the indicated siRNAs and filmed. The time from anaphase until the start of Cdt1 degradation was plotted (control, n = 29; siMAD2, n = 58; siMCM4, n = 51; mean ± SD; Mann-Whitney test; ***, P < 0.0001).

Similar articles

Cited by

References

    1. Amador V., Ge S., Santamaría P.G., Guardavaccaro D., Pagano M. 2007. APC/C(Cdc20) controls the ubiquitin-mediated degradation of p21 in prometaphase. Mol. Cell. 27:462–473 10.1016/j.molcel.2007.06.013 - DOI - PMC - PubMed
    1. Arias E.E., Walter J.C. 2005. Replication-dependent destruction of Cdt1 limits DNA replication to a single round per cell cycle in Xenopus egg extracts. Genes Dev. 19:114–126 10.1101/gad.1255805 - DOI - PMC - PubMed
    1. Arias E.E., Walter J.C. 2007. Strength in numbers: preventing rereplication via multiple mechanisms in eukaryotic cells. Genes Dev. 21:497–518 10.1101/gad.1508907 - DOI - PubMed
    1. Ballabeni A., Melixetian M., Zamponi R., Masiero L., Marinoni F., Helin K. 2004. Human geminin promotes pre-RC formation and DNA replication by stabilizing CDT1 in mitosis. EMBO J. 23:3122–3132 10.1038/sj.emboj.7600314 - DOI - PMC - PubMed
    1. Brinkley B.R., Zinkowski R.P., Mollon W.L., Davis F.M., Pisegna M.A., Pershouse M., Rao P.N. 1988. Movement and segregation of kinetochores experimentally detached from mammalian chromosomes. Nature. 336:251–254 10.1038/336251a0 - DOI - PubMed

Publication types