. 2013 Aug;195(16):3784-95.
doi: 10.1128/JB.00384-13. Epub 2013 Jun 14.

Transcription of the Escherichia coli fatty acid synthesis operon fabHDG is directly activated by FadR and inhibited by ppGpp

Affiliations

Transcription of the Escherichia coli fatty acid synthesis operon fabHDG is directly activated by FadR and inhibited by ppGpp

Laetitia My et al. J Bacteriol. 2013 Aug.

Abstract

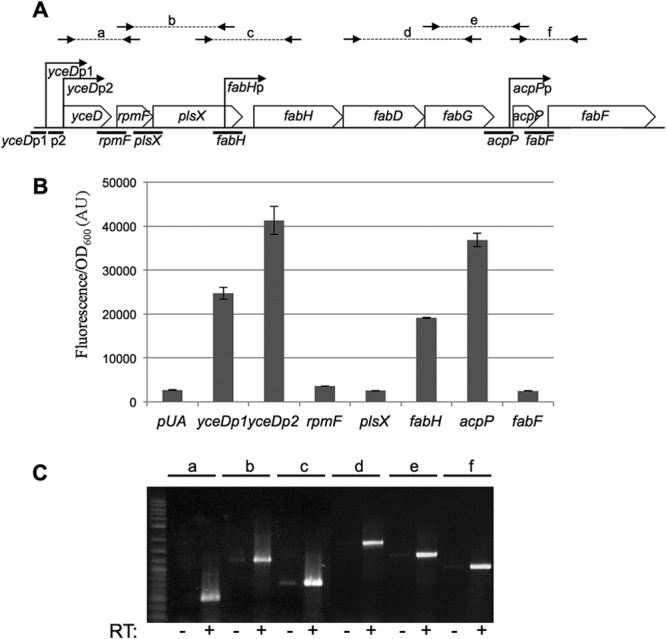
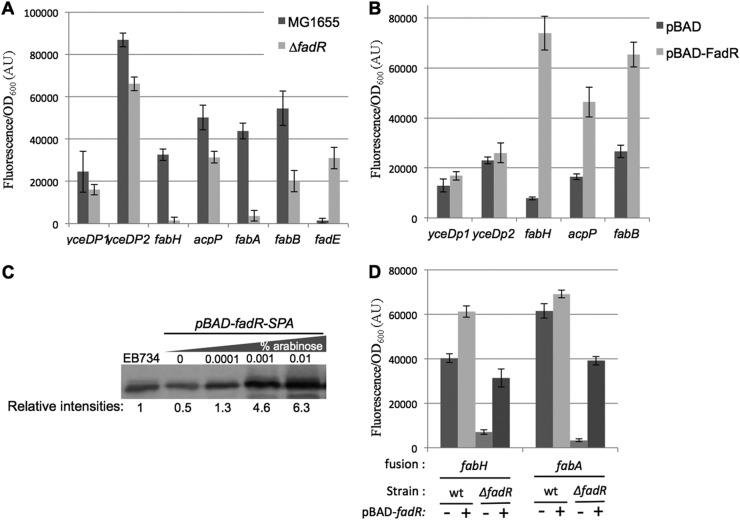
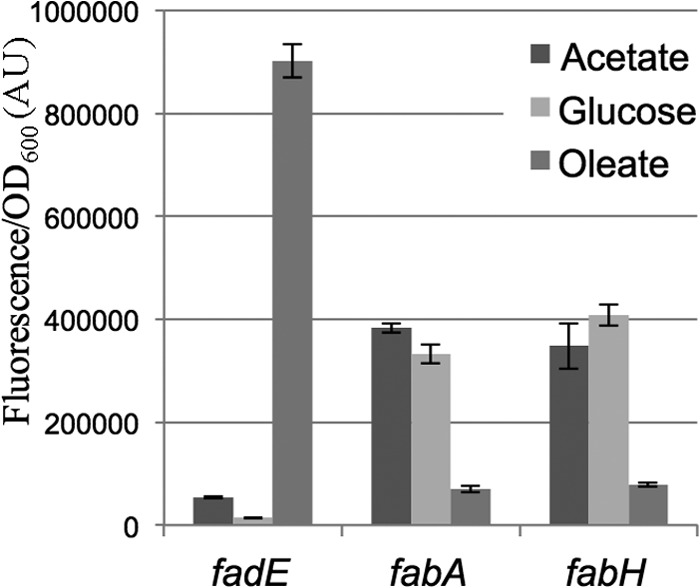
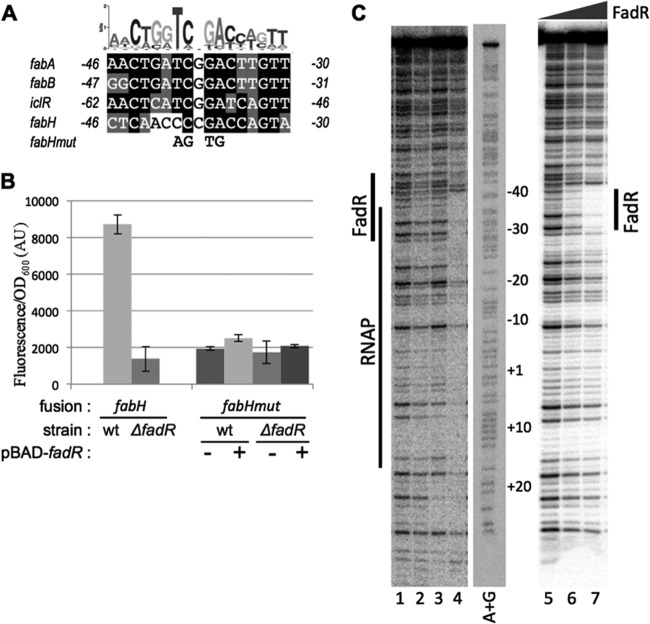
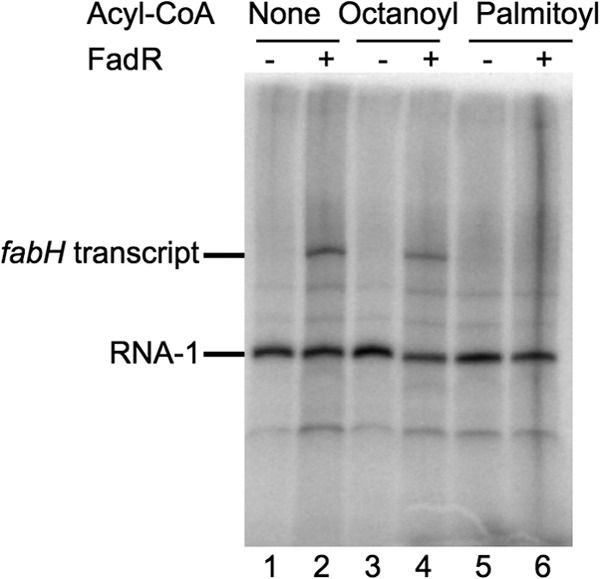
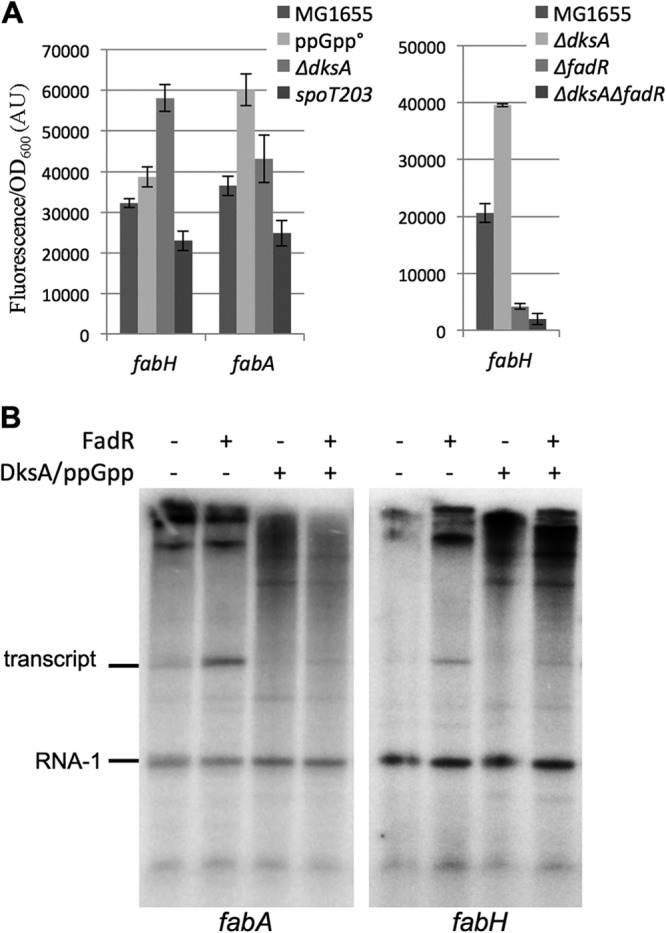
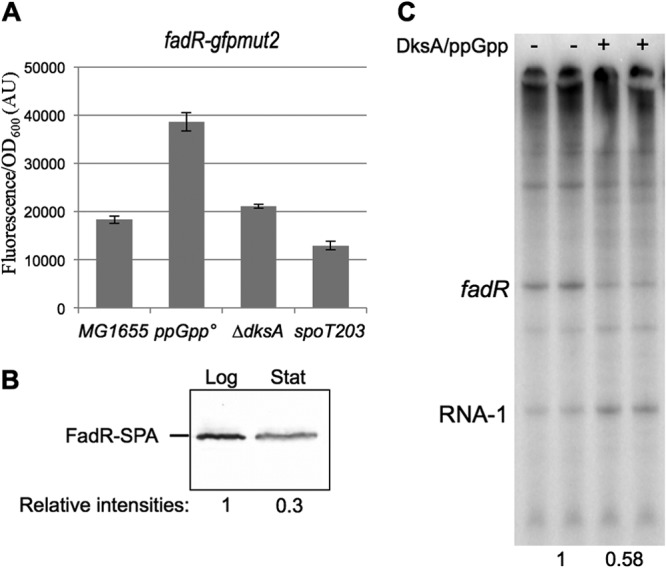
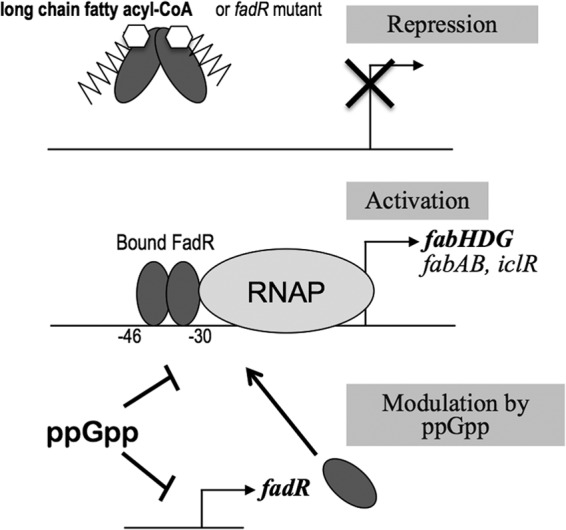
In Escherichia coli, FadR and FabR are transcriptional regulators that control the expression of fatty acid degradation and unsaturated fatty acid synthesis genes, depending on the availability of fatty acids. In this report, we focus on the dual transcriptional regulator FadR. In the absence of fatty acids, FadR represses the transcription of fad genes required for fatty acid degradation. However, FadR is also an activator, stimulating transcription of the products of the fabA and fabB genes responsible for unsaturated fatty acid synthesis. In this study, we show that FadR directly activates another fatty acid synthesis promoter, PfabH, which transcribes the fabHDG operon, indicating that FadR is a global regulator of both fatty acid degradation and fatty acid synthesis. We also demonstrate that ppGpp and its cofactor DksA, known primarily for their role in regulation of the synthesis of the translational machinery, directly inhibit transcription from the fabH promoter. ppGpp also inhibits the fadR promoter, thereby reducing transcription activation of fabH by FadR indirectly. Our study shows that both ppGpp and FadR have direct roles in the control of fatty acid promoters, linking expression in response to both translation activity and fatty acid availability.


Figures

Fig 1
Fig 1
Genetic organization of the fab-acpP locus. (A) Organization of the fab-acpP locus. The promoters indicated with arrows are the ones characterized in this study and were described previously: yceDp1 and yceDp2 (35), fabH (32), and acpP (37). Thick lines below the locus indicate the DNA regions assayed for promoter activity with transcriptional fusion in the experiment shown in panel B. Small arrows and letters above the panel indicate the positions of hybridization of the oligonucleotides used for the RT-PCR experiment shown in panel C. (B) The MG1655 strain was transformed by the indicated transcriptional fusions with gfp. Relative fluorescence intensities were measured after overnight growth in LB at 30°C (see Materials and Methods). pUA is the control plasmid pUA66 (39). (C) RT-PCRs were performed on total RNA prepared on MG1655 cells in exponential phase, with oligonucleotide pairs as follows: PCR a, ebm567/267; PCR b, ebm266/554; PCR c, ebm553/260; PCR d, ebm270/273; PCR e, ebm272/49; PCR f, ebm48/134 (see Table S1 in the supplemental material for the sequences of the oligonucleotides). The positions of hybridization of the oligonucleotides are indicated in panel A. − and + indicate the absence or presence of the reverse transcriptase (RT) enzyme in the reaction mixture, respectively.
Fig 2
Fig 2
FadR activates the fabH promoter. (A) MG1655 and ΔfadR (EB586) strains were transformed by the indicated transcriptional fusions with gfp. Relative fluorescence intensities of 4 independent clones grown at 30°C in LB supplemented with 50 μg/ml kanamycin were measured in log phase. (B) The MG1655 strain was transformed by both the indicated transcriptional fusions with gfp and either the control pBAD24 plasmid or pBAD-FadR (pEB1210). Relative fluorescence intensities were measured after overnight growth at 30°C in LB supplemented with 50 μg/ml kanamycin, 100 μg/ml ampicillin, and 0.05% arabinose (see Materials and Methods). (C) The amounts of FadR-SPA protein produced in EB734 strain and in MG1655 transformed by pBAD-fadR-SPA (pEB1502) were compared by Western blotting using an anti-Flag antibody and fluorescent secondary antibodies. The intensities of the bands were then quantified with a fluorescent imager (Li-Cor). The results normalized to the EB734 strain are indicated below the gel. (D) MG1655 and ΔfadR (EB586) strains were transformed by both the fabH or fabA transcriptional fusions with gfp and either the control pBAD plasmid or pBAD-FadR (pEB1210). Relative fluorescence intensities of 6 independent clones were measured after overnight growth at 30°C in LB supplemented with 50 μg/ml kanamycin, 100 μg/ml ampicillin, and 0.0001% arabinose. wt, wild type.
Fig 3
Fig 3
Long-chain acyl-CoA inhibits the fabH promoter. The MG1655 strain was transformed by the fadE, fabA, or fabH transcriptional fusions with gfp. Relative fluorescence intensities of 4 independent clones for each assay were measured in log-phase cells, grown at 30°C in minimal medium containing either 0.2% acetate, 0.2% glucose, or 0.2% oleate as the sole carbon source.
Fig 4
Fig 4
FadR binding site on fabH promoter. (A) The putative FadR binding site in the fabH promoter is aligned with the sequences of the FadR binding site in fabA, fabB, and iclR promoters described previously (15, 16, 57). The limits of the binding site are indicated relative to the transcription start site. The logo computed for the FadR binding site in Enterobacteriales (6) is shown on top. The mutations introduced in the fabHmut-gfp fusion (pEB1298) are indicated below the alignment. (B) MG1655 and ΔfadR (EB586) strains were transformed by both the indicated transcriptional fusions with gfp and either the control pBAD plasmid or pBAD-FadR (pEB1210). Relative fluorescence intensities of 6 independent clones were measured after overnight growth at 30°C in LB supplemented with 50 μg/ml kanamycin, 100 μg/ml ampicillin, and 0.05% arabinose. (C) Footprint of FadR and RNAP on the promoter of fabH. Labeled fabH template was incubated with FadR, RNAP, or both FadR and RNAP and subjected to DNase I footprinting assay. Lanes: 1, template alone; 2, 1 μM FadR; 3, 15 nM RNAP; 4, 1 μM FadR plus 15 nM RNAP; 5, template alone; 6, 500 nM FadR; 7, 1 μM FadR. The positions are indicated relative to the +1 transcription start site, using an adjacent A+G sequence ladder (A+G lane). The deduced positions of FadR and RNAP protection are indicated next to the gel images. Lane 2 is somewhat underloaded, but normalization of the profiles confirmed that there was little protection by FadR alone in the region corresponding to the position of the predicted FadR binding site.
Fig 5
Fig 5
The fabH promoter is activated by FadR in vitro. Single-round in vitro transcription from the fabH plasmid template in the presence or absence of 2 μM FadR, together with octanoyl-CoA or palmitoyl-CoA. The plasmid-derived RNA-1 transcript served as a loading control.
Fig 6
Fig 6
Regulation of fabH by ppGpp. (A) MG1655, ΔrelA ΔspoT (ppGpp°, EB425), ΔdksA (EB559), ΔrelA spoT203 (spoT203, EB544), ΔfadR (EB586), and ΔdksA ΔfadR (EB598) strains were transformed by fabH or fabA transcriptional fusions with gfp. Relative fluorescence intensities of 4 independent clones, grown in LB supplemented with 50 μg/ml kanamycin at 30°C for each assay, were measured in log phase. (B) Single-round in vitro transcription from the fabH and fabA plasmid templates in the presence or absence of 2 μM FadR, 2 μM DksA, and 100 mM ppGpp. The plasmid-derived RNA-1 transcript served as a loading control.
Fig 7
Fig 7
Regulation of fadR expression. (A) MG1655, ΔrelA ΔspoT (ppGpp°, EB425), ΔdksA (EB559), and ΔrelA spoT203 (spoT203, EB544) strains were transformed by the fadR transcriptional fusions with gfp. Relative fluorescence intensities of 6 independent clones were measured after growth overnight in LB supplemented with 50 μg/ml kanamycin at 30°C. (B) Strain EB734 producing FadR-SPA was grown at 37°C in LB. Equal amounts of total cell extracts prepared at an OD600 of 0.5 (Log) or after growth overnight (Stat) were analyzed by 10% SDS-PAGE and Western blotting with an anti-Flag antibody. The Western blot was then analyzed with fluorescent secondary antibodies and a fluorescent imager (Li-Cor) in order to quantify the relative intensities of log- and stationary-phase bands. (C) Single-round in vitro transcription from the fadR plasmid template in the presence or absence of 2 μM DksA and 100 mM ppGpp. The plasmid-derived RNA-1 transcript served as a loading control. The intensities of the bands quantified and normalized to the assay without DksA/ppGpp are indicated below the gel.
Fig 8
Fig 8
Model for regulation of fabH promoter by FadR. The fabA, fabB, iclR, and fabH genes are similarly regulated. A dimer of FadR binds the fabH promoter between −30 and −46 relative to the transcription start site. It recruits RNAP and activates transcription (middle). Binding of long-chain acyl-CoA results in conformational modification of FadR, which prevents DNA binding, and as a consequence, the transcription is shut down (top). ppGpp directly inhibits the fabH promoter (and fabA and potentially other fab promoters) and the fadR promoter. As a consequence, lower levels of FadR proteins also diminish the transcription from the fabH promoter (bottom).

Similar articles

Cited by

References

    1. Cronan JE, Thomas J. 2009. Bacterial fatty acid synthesis and its relationships with polyketide synthetic pathways. Methods Enzymol. 459:395–433 - PMC - PubMed
    1. Zhang YM, Rock CO. 2008. Membrane lipid homeostasis in bacteria. Nat. Rev. Microbiol. 6:222–233 - PubMed
    1. DiRusso CC, Black PN, Weimar JD. 1999. Molecular inroads into the regulation and metabolism of fatty acids, lessons from bacteria. Prog. Lipid Res. 38:129–197 - PubMed
    1. Parsons JB, Rock CO. 2013. Bacterial lipids: metabolism and membrane homeostasis. Prog. Lipid Res. 52:249–276 - PMC - PubMed
    1. Fujita Y, Matsuoka H, Hirooka K. 2007. Regulation of fatty acid metabolism in bacteria. Mol. Microbiol. 66:829–839 - PubMed

Publication types

MeSH terms

LinkOut - more resources