. 2013 Aug;15(8):978-90.
doi: 10.1038/ncb2784. Epub 2013 Jun 16.

A complex secretory program orchestrated by the inflammasome controls paracrine senescence

Affiliations

A complex secretory program orchestrated by the inflammasome controls paracrine senescence

Juan Carlos Acosta et al. Nat Cell Biol. 2013 Aug.

Abstract

Oncogene-induced senescence (OIS) is crucial for tumour suppression. Senescent cells implement a complex pro-inflammatory response termed the senescence-associated secretory phenotype (SASP). The SASP reinforces senescence, activates immune surveillance and paradoxically also has pro-tumorigenic properties. Here, we present evidence that the SASP can also induce paracrine senescence in normal cells both in culture and in human and mouse models of OIS in vivo. Coupling quantitative proteomics with small-molecule screens, we identified multiple SASP components mediating paracrine senescence, including TGF-β family ligands, VEGF, CCL2 and CCL20. Amongst them, TGF-β ligands play a major role by regulating p15(INK4b) and p21(CIP1). Expression of the SASP is controlled by inflammasome-mediated IL-1 signalling. The inflammasome and IL-1 signalling are activated in senescent cells and IL-1α expression can reproduce SASP activation, resulting in senescence. Our results demonstrate that the SASP can cause paracrine senescence and impact on tumour suppression and senescence in vivo.


Figures
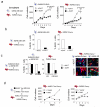
Figure 1
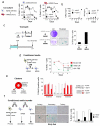
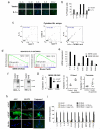
Figure 1. Cells undergoing oncogene-induced senescence (OIS) can induce paracrine arrest of normal cells
(a) Co-culture with cells undergoing OIS induces the arrest of normal IMR90 cells. Normal IMR90 human fibroblasts expressing the fluorescent marker mCherry (IMR90 Cherry), were mixed with IMR90 ER:RAS cells. When indicated 200 nM 4OHT was added to activate ER:RAS. Growth curves represent the number of IMR90 ER:RAS (left) or IMR90 Cherry cells (right) present in the co-cultures. Data is a representative experiment of n=2 independent experiments for days 0-7 and mean +/− s.d. of n= 3 independent experiments for day 8. The source data for 2 independent experiments and statistics for day 8 (Student’s t-test) are provided in Supplementary Table S8. (b) Co-culture with IMR90 MEK:ER cells induces the arrest of normal IMR90 cells. The percentage of positive BrdU cells for each population in the cocultures 4 days after 4OHT induction is shown. Data is a representative experiment. The source data for 2 independent experiments are provided in Supplementary Table S8. (c) IMR90 ER:RAS or IMR90 ER cells were co-cultured with normal IMR90 Cherry fibroblasts. BrdU incorporation at day 7 shows that co-culture with IMR90 ER:RAS but not with IMR90 ER induces the arrest of normal IMR90 Cherry cells (centre). Data is a representative experiment. The source data for 2 independent experiments are provided in Supplementary Table S8. Representative images are shown (right). Scale bar, 30 μm. (d) Normal HMEC or IMR90 cells suffer growth arrest when co-cultured with HMEC cells undergoing OIS. HMEC-hTERT (centre) or IMR90 (right) cells expressing Cherry as a fluorescent marker were co-cultured with HMEC-TERT ER:RAS or HMEC-TERT vector cells in the presence of 100 nM 4OHT. Growth curves showing growth arrest of HMEC-TERT Cherry (centre) or IMR90-Cherry cells (right) are shown. Data is a representative experiment.
Figure 2
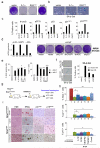
Figure 2. Paracrine senescence is a stable arrest mediated by soluble factors
(a) Quantification of the percentage of IMR90 ER:RAS (centre) and IMR90 Cherry cells (right) incorporating BrdU during the course of 7 days after activation with 4OHT in co-cultures. Data is a representative experiment. The source data for 2 independent experiments are provided in Supplementary Table S8. (b) Kinetics of the production of secreted factors during OIS. Conditioned media from IMR90 ER:RAS cells was collected and used to detect CXCL1 (left) or IL-8 (right) levels by ELISA. Data is a representative experiment. The source data for 2 independent experiments are provided in Supplementary Table S8. (c) Paracrine senescence is a stable arrest. Cells were co-cultured separated by transwells. After a week IMR90 cells in the bottom were split, seeded and cultured alone for 14 additional days. CV (centre) and SA-β-Gal staining (right) is shown. Scale bar, 50 μm. (d) Conditioned media from senescent cells induces paracrine senescence. Diagram explaining the CM experiments (left). CM was collected from IMR90 vector or IMR90 ER:RAS cells grown 7 days in the presence 200 nM 4OHT. The effect of CM on IMR90 cells was evaluated by BrdU staining (right). Data is a representative experiment of n=2 independent experiments for days 1-3 and mean +/− s.d. of n= 3 independent experiments for day 4. The source data for 2 independent experiments and statistics for day 4 (Student’s t-test) are provided in Supplementary Table S8. (e) Fibroblast undergoing OIS induce growth arrest on normal neighboring fibroblasts. IMR90 ER:RAS cells were seeded in ‘clusters’ surrounded of normal IMR90-Cherry cells with the help of cloning cylinders (left). Cells were grown in the presence or absence of 200 nM 4OHT for 7 days. Percentage of BrdU positive cells was calculated in consecutive fields in the external (IMR90-Cherry) and internal region (IMR90-ER:RAS). Data is mean +/− s.d. of n= 3 optical fields. (f) An experiment testing serial transfer of senescence by conditioned media showed a limited arrest with absence of SA-β-Gal positive cells in ‘tertiary’ cells. Data is representative of n=2 independent experiments. Scale bar, 50 μm.
Figure 3
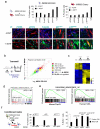
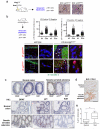
Figure 3. Paracrine senescence depends on the p16INK4a/Rb and p53/p21CIP1 tumour suppressor networks
(a) IMR90-Cherry cells were co-cultured with IMR90 ER:RAS cells in the presence or absence of 200 nM 4OHT. 7 days after 4OHT treatment, cells were subjected to IF. The percentage of IMR90 ER:RAS (top, centre) or IMR90 Cherry cells (top, right) positive for each of the markers is shown. Data is a representative experiment. The source data for 2 independent experiments are provided in Supplementary Table S8. Representative pictures are shown in the bottom. Scale bar, 30 μm. (b) mRNA expression profiling of IMR90, IMR90 ER:RAS or IMR90 cells cultured in Transwells together with IMR90 vector or IMR90 ER:RAS cells during 7 days in the presence of 200 nM 4OHT and 0.5 % FBS. The plot shows the correlation between cells undergoing OIS and paracrine senescence. (c) Hierarchical clustering of genes changing more than 2-fold, centred in a cluster that defines the equivalence between OIS and paracrine senescence. (d) GSEA of a signature associated with senescence in IMR90 cells undergoing paracrine senescence. (e) A signature derived from IMR90 cells undergoing paracrine senescence is found enriched in mouse PANIN and human serrated sessile adenomas (SSA) . NES, normalized enrichment score; FDR, false discovery rate. (f) Paracrine senescence is dependent on the p53/p21CIP1a and p16INK4a pathways. IMR90 cells were transfected with the indicated siRNAs. The next day, CM from IMR90 ER:RAS or IMR90 vector cells was added. The proliferation of IMR90 ER:RAS cells was assessed by BrdU incorporation 2 days after CM addition (right).). Data are mean ± s.d., n = 3 independent experiments. The source data and statistics (Student’s t-test) are provided in Supplementary Table S8. IMR90 cells transfected with the different siRNAs were subjected to IF as a control for knockdown efficiency (centre).
Figure 4
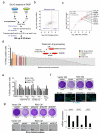
Figure 4. Multiple components of the SASP are involved on paracrine senescence
(a) Diagram summarizing the proteomics approach. (b) Comparison between mRNA and protein expression for the secretome of cells undergoing OIS. Overall Pearson correlation is 0.64. A lower correlation was observed for proteins induced more than 4-fold (red line, Pearson correlation=0.15). This suggests post-trancriptional upregulation of SASP components (e.g. MMP7, IGFBP5, IGFBP6, THBS1, THBS2 and IL6ST). (c) Plot of 2 forward and reverse SILAC experiments. Significant changes in at least 2/3 experiments are coloured. (d) Screening for compounds inhibiting paracrine senescence. IMR90 fibroblasts were grown in the indicated CM in the presence of a collection of 78 drugs. 2 days later, BrdU incorporation was measured. −, IMR90 treated with DMSO and grown in CM of IMR90 ER:RAS − 4OHT; +, IMR90 treated with DMSO and grown in CM of IMR90 ER:RAS +4OHT. A gray area represents an arbitrary cut-off of 120 % the value of BrdU in the no drug control (+). Inhibitors over the cut-off targeting VEGFR2 and/or FLT3 (orange), CCR2 (green) or TGFBR1 (brown) are marked. Data are mean ± s.d., n = 3 independent screen plates. (e) IMR90 cells cultured 2 days with the indicated CM and drugs (concentrations 10 μM to 10 nM). Proliferation was evaluated by BrdU incorporation. Graph shows one representative experiment out of two independent experiments. (f) Infected IMR90 cells were treated with CM and growth evaluated by CV (top). Data are one representative experiment out of two independent experiments. IF against CCR2 is shown as a control for the efficiency of the shRNAs used (bottom). Scale bar, 10 μm. (g) Knockdown of receptors of the TGFβ family partially rescue paracrine senescence. IMR90 cells infected with the indicated vectors were treated with CM of senescent or control cells and senescence evaluated 10-14 days after by CV (top left) and SA-β-Gal staining (bottom left). Knock down efficiency was measured by qRT-PCR (right). Data are one representative experiment out of 2 independent experiments. The source data for 2 independent experiments are provided in Supplementary Table S8. Scale bar, 50 μm.
Figure 5
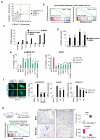
Figure 5. A role for TGFβ signalling on mediating paracrine senescence
(a) Comparing the paracrine and autocrine screens. Autocrine screen is in Sup Fig S5A. (b) GSEA of TGFβ target genes during OIS and paracrine senescence.. (c) qRT-PCR for a set of TGFβ target genes in OIS and paracrine senescence. Data are mean ± s.d., n = 3 independent experiments (d) Induction of TGFβ ligands during OIS by qRT-PCR (bars). Induction in the SILAC experiments is in blue. Data are mean ± s.d., n = 3 independent experiments (e) IMR90 cells were treated with CM and 10 μg/ml of antibodies for 2 days. Growth was evaluated by BrdU incorporation (right). Percentage of cells positive for p-SMAD2/3 is presented (left). Data are mean ± s.d., n = 4 independent experiments. p was calculated using Student’s t-Test. pSMAD 2/3 statistics: ActivinA p=0.0037; TGFβ p =0.91; BMP2 p =0.52; ActivinA/TGFβ p =0.0029; ActivinA/TGFβ/BMP2 p =0.040; TGFβ inhibitor II p value 0.0007. For BrdU, statistics: ActivinA p=0.009905573; TGFβ p =0.282677043; BMP2 p =0.233112557; ActivinA/TGFβ p =0.000723521; ActivinA/TGFβ/BMP2 p =0.002428509; TGFβ inhibitor II p =4.44×10⁻⁵. Source data are in Supplementary Table S8. (f) TGFBR1 inhibitors partially prevent paracrine senescence. IF against phosphorylated SMAD2/3. Scale bar, 10 μm. Representative pictures (left). IMR90 cells were treated as indicated. INK4b and CDKN1a expression measured by qRT-PCR (right). Data are mean ± s.d., (n = 3 independent experiments, p, Student’s t-Test). pSMAS2/3 statistics: Inhibitor I p= 4.49×10⁻⁵; Inhibitor II 4.53×10⁻⁵. INK4B statistics: Inhibitor I p =0.00083; Inhibitor II p= 0.010. CDKN1A statistics: Inhibitor I p = 0.00054; Inhibitor II p = 0.00014. Source data are provided in Supplementary Table S8. (g) Alk5 deletion suppresses KrasG12D-driven OIS in PANIN. Diagram showing mice strains used (top left). GSEA shows TGFβ activation in PANIN (bottom left). Ki67 and SA-β-Gal staining (centre) and quantification (right) showing decreased senescence in pancreatic lesions of Pdx1-cre KrasG12D/+ TGFβR1fl/fl mice. Scale bar, 100 μm. Boxplot represent first and third quartiles (n=5 mice per condition). Inside lines shows median. Whiskers extend to highest or lowest observation. p= 0.0184 for both experiments calculated using Mann-Whitney.
Figure 6
Figure 6. The inflammasome regulates the senescence secretome
(a-b) IMR90 cells were infected with a vector that expresses IL-1α or a control and IF of the indicated SASP components performed. Scale bar, 30 μm. (b) Quantification of (a). (c) IL-1α activates a SASP-like response. IMR90 cells were infected with retroviruses expressing RASG12V, IL-1α or Inhibin A. When indicated 4 μM TGFBR1 inhibitor II was used. CM was used to probe chemokine and cytokine antibody arrays. (d) Gene set enrichment analysis (GSEA) of IL1R pathway in the gene expression profile of IMR90 cells undergoing OIS (left) and mouse PANIN (right). FDR, false discovery rate; NES, normalized enrichment score. (e) qRT-PCR analysis showing the expression of a set of genes involved on IL1R signalling. Data are one representative experiment out of 2 independent experiments. (f) IB with antibodies against IL-1α and IL-1β in CM collected from IMR90 ER:RAS (RAS) or IMR90 vector cells (Vector) incubated during 7 days with 200 nM 4OHT and 0.5 % FBS. Pro, precursor form; mat, mature form. (g) Activation of the inflammasome during OIS. IMR90 ER:RAS cells (left) and murine models of SSA (centre) and PANIN (right) display increased Caspase 1 activity. Data are mean ± s.d., n = 4, 3, 6 and 8 different samples for control (GI tract), SSA, control (pancreas), and PanIN respectively. (h) IMR90 ER:RAS cells cultured in the presence or absence of 200 nM 4OHT were subjected to IF with antibodies recognizing inflammasome components. A control of IMR90 ER:RAS cells + 4OHT without primary ab (No ab) is shown in the lower row. Scale bar, 10 μm. (i) IMR90 ER:RAS or IMR90 vector cells were cultured in the presence of 200 nM 4OHT and 0.5 % FBS during 7 days with 10 μM Caspase-1 inhibitor or 20 μM IL1R antagonist. After that time, cells were processed and qRT-PCR against different SASP components performed. Data are mean ± s.d., n = 3 independent experiments. Data from this experiment is also presented in Fig S6j.
Figure 7
Figure 7. IL-1 signalling regulates senescence
(a) IMR90 were infected as indicated and proliferation measured by CV. (b) SA-β-Gal staining. Scale bar, 50 μm. (c) IF using the indicated antibodies. Data is a representative experiment. Source data for 2 independent experiments are provided in Supplementary Table S8. (d) IMR90 ER:RAS were infected as indicated and cell growth analysed by CV (right). qRT-PCR showing knockdown efficiency (left). Data are one representative experiment out of 2 independent experiments. (e) IMR90 ER:RAS cells were tretaed as indicated. BrdU incorporation and p21CIP1 expression were measured. Data are mean ± s.d., n = 3 independent experiments. p was calculated using Student’s t-Test. For BrdU, IL1R inh p = 5.30×10⁻⁵; Casp inh I p = 0.013; Casp inh II p = 0.013. For p21, IL1R inh p = 6.73×10⁻⁶; Casp inh I p = 1.42×10⁻⁵; Casp inh II p = 0.00047. Source data are provided in Supplementary Table S8. (f) Knockdown of IL1R prevents paracrine senescence. IMR90 cells infected and treated as indicated. After 10-14 days, cells were stained for SA-β-Gal. Data is representative experiment. Source data for 2 independent experiments are provided in Supplementary Table S8. (g-i) Inhibition of IL-1R reduces senescence and immune clearance in vivo. (g) NrasG12V or NrasG12V/D38A transposons and a transposase were co-delivered into mouse livers via hydrodynamic injection. Mice were treated with carrier or drugs for 12 days. (h) Quantification of Nras- (top), p21Cip1- (centre) and p16Ink4a- (bottom) positive cells on liver sections. Student’s t-test (n=5 mice per condition): carrier/ NrasG12V vs. IL1R/ NrasG12V, *P< 0.0150, Carrier/ NrasG12V vs. Inhibitor combination/ NrasG12V, **P< 0.002, p21: Carrier/ NrasG12V vs. IL1R/ NrasG12V, *P< 0.0341, Carrier/ NrasG12V vs. Inhibitor combination/ NrasG12V, *P< 0.0116, p16: Carrier/ NrasG12V vs. Inhibitor combination/ NrasG12V, *P< 0.01. 1, delivery of NrasG12V/D38A and treatment with vehicle. 2-7 delivery of NrasG12V. Treatments: 2, vehicle; 3, IL1R inhibitor; 4, CCR2 inhibitor; 5, VEGFR2 inhibitor; 6, TGFBR1 inhibitor; 7, combination of the 4 inhibitors. Data are mean ± s.e.m. (i) Representative pictures of H&E and IHC for Nras, p2Cip1 and p16Ink4a. Scale bar, 100 μm.
Figure 8
Figure 8. Paracrine senescence is observed in mouse and human models of OIS in vivo
(a) Paracrine senescence in the liver. Immunohistochemistry images showing senescent hepatocytes surrounded by clusters of immune cells. Immune cells positive for p21Cip (left) and p16Ink4a (right) are marked by asterisks. Scale bar, 50 μm. (b) Stroma cells in the vicinity to papillomas in the skin of K5-Sos Egfrwa2/+ mice show the presence of cells positive for p21Cip1 and p16Ink4a. Arrows show senescent cells in the Keratin 5 negative population. Staining for p16Ink4a (pictures, top) and p21Cip1 (pictures, bottom) is shown in red. Keratin 5 is shown in green. Nuclei are shown in blue. Merged pictures are presented. A close up is shown to the right, and a wider view in the left. Bars are 10 μm. Graph showing the quantification of p16Ink4a (top, centre) and p21Cip1 (top right) nuclear levels in cells in the epidermis (Keratin 5 positive) or dermis (Keratin 5 negative) are shown (left). For p21: wt K5+ n=102; wt K5− n=108; Sos K5+ n=460; Sos K5− n=536. For p16: wt K5+ n=100; wt K5− n=105; Sos K5+ n=597; Sos K5− n=939. n= number of cells. Scale bar, 10 μm. (c-e) Stromal cells in the vicinity to human SSA present high levels of p21CIP1 expression. (c) Epithelial cells in the crypts from serrated sessile adenomas (SSA) are positive for activated BRAF and p21CIP1a, but negative for KI-67. Close up shown here pictures correspond to images shown at the bottom of the panel. Scale bar, 25 μm in top panel and 100 μm in bottom panel. (d) IHC showing representative staining of CCL2 in normal colon and SSA. 6/11 samples showed higher CCL2 expression in SSA than normal colon, while 2/11 have a higher pattern of expression in normal colon than SSA. Scale bar, 100 μm. (e) The percentage of stromal p21CIP1 positive cells close to the normal colon or SSA is significantly different Box represents the first and third quartiles and the line inside shows the median. Whiskers extend upward and downward to the highest or lowest observation. Unpaired t-test (p=0.03, n=10 samples/condition).

Comment in

Similar articles

Cited by

References

    1. Kuilman T, Michaloglou C, Mooi WJ, Peeper DS. The essence of senescence. Genes Dev. 2010;24:2463–79. - PMC - PubMed
    1. Campisi J, d’Adda di Fagagna F. Cellular senescence: when bad things happen to good cells. Nat Rev Mol Cell Biol. 2007;8:729–40. - PubMed
    1. Kuilman T, Peeper DS. Senescence-messaging secretome: SMS-ing cellular stress. Nat Rev Cancer. 2009;9:81–94. - PubMed
    1. Coppe JP, et al. A human-like senescence-associated secretory phenotype is conserved in mouse cells dependent on physiological oxygen. PLoS One. 2010;5:e9188. - PMC - PubMed
    1. Krtolica A, Parrinello S, Lockett S, Desprez PY, Campisi J. Senescent fibroblasts promote epithelial cell growth and tumorigenesis: a link between cancer and aging. Proc Natl Acad Sci U S A. 2001;98:12072–7. - PMC - PubMed

Publication types