. 2013 Jun 12;33(24):10085-97.
doi: 10.1523/JNEUROSCI.5271-12.2013.

Retinal input regulates the timing of corticogeniculate innervation

Affiliations

Retinal input regulates the timing of corticogeniculate innervation

Tania A Seabrook et al. J Neurosci. .

Abstract

Neurons in layer VI of visual cortex represent one of the largest sources of nonretinal input to the dorsal lateral geniculate nucleus (dLGN) and play a major role in modulating the gain of thalamic signal transmission. However, little is known about how and when these descending projections arrive and make functional connections with dLGN cells. Here we used a transgenic mouse to visualize corticogeniculate projections to examine the timing of cortical innervation in dLGN. Corticogeniculate innervation occurred at postnatal ages and was delayed compared with the arrival of retinal afferents. Cortical fibers began to enter dLGN at postnatal day 3 (P3) to P4, a time when retinogeniculate innervation is complete. However, cortical projections did not fully innervate dLGN until eye opening (P12), well after the time when retinal inputs from the two eyes segregate to form nonoverlapping eye-specific domains. In vitro thalamic slice recordings revealed that newly arriving cortical axons form functional connections with dLGN cells. However, adult-like responses that exhibited paired pulse facilitation did not fully emerge until 2 weeks of age. Finally, surgical or genetic elimination of retinal input greatly accelerated the rate of corticogeniculate innervation, with axons invading between P2 and P3 and fully innervating dLGN by P8 to P10. However, recordings in genetically deafferented mice showed that corticogeniculate synapses continued to mature at the same rate as controls. These studies suggest that retinal and cortical innervation of dLGN is highly coordinated and that input from retina plays an important role in regulating the rate of corticogeniculate innervation.


Figures
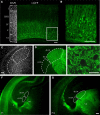
Figure 1.
Figure 1.
τ-GFP expression in neocortex and dLGN of golli-τ-GFP mice. A, Coronal section of visual cortex at P14 shows the distribution of neurons expressing τ-GFP (green). Inset on the far left is DAPI stain of the same section and is used to illustrate the boundaries of cortical layers. τ-GFP-labeled neurons are restricted to layer VI. B, High-power image of τ-GFP expressing neurons for the outlined area in A. CE, Coronal section of dLGN in the same P14 mouse. C, DAPI delineates the boundaries of dLGN from other adjacent nuclei. D, Image showing the corresponding corticogeniculate axon arbors and terminals expressing τ-GFP. Note the lack of τ-GFP fluorescence in vLGN. IGL indicates intergeniculate leaflet. Scale bars, 100 μm. E, High-power confocal image of τ-GFP expression in dLGN from D. The areas lacking label are the locations of dLGN cell bodies. Scale bar, 20 μm. F,G, The pattern of cortical innervation in thalamus is shown in coronal sections from P1 (F) and P14 (G) golli-τ-GFP mice. F, At P1, τ-GFP corticothalamic fibers are depicted as they course through the internal capsule and innervate nuclei in the ventrolateral part of thalamus. Note the lack of innervation in dorsomedial regions of thalamus and dLGN. G, At P14, corticothalamic innervation appears complete. IC indicates internal capsule. Scale bar, 200 μm.
Figure 2.
Figure 2.
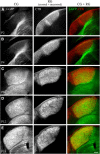
Innervation of dLGN by cortical and retinal projections. AE, Coronal sections from golli-τ-GFP mice at different postnatal ages. Corticogeniculate projections were visualized with τ-GFP (left). Retinogeniculate projections were labeled by making eye injections of CTB conjugated to Alexa Fluor 594 in both eyes. Shown are the crossed and uncrossed retinal projections from one hemisphere of dLGN (middle). Right panel shows merged images of corticogeniculate (green) and retinogeniculate (red) projections. CG indicates corticogeniculate projections; RG, retinogeniculate projections. Scale bar, 100 μm.
Figure 3.
Figure 3.
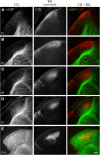
Innervation of dLGN by cortical and uncrossed retinal projections. AE, Coronal sections from golli-τ-GFP mice at different postnatal ages. Corticogeniculate projections were visualized with τ-GFP (left). Retinogeniculate projections were labeled by making eye injections of CTB conjugated to Alexa Fluor 594 in one eye. Shown are the uncrossed retinal projections from one hemisphere of dLGN (middle). Right panel shows merged images of corticogeniculate (green) and uncrossed retinogeniculate (red) projections. CG inicates corticogeniculate projections; RG, retinogeniculate projections. Scale bar, 100 μm.
Figure 4.
Figure 4.
Coordinated innervation of retinal and cortical projections in dLGN. Shown is a summary graph plotting the percent area in dLGN occupied by crossed and uncrossed retinogeniculate projections (red, filled circle), uncrossed retinogeniculate projections (red, open circle), and corticogeniculate projections (green, filled circle) as a function of age. Shown are means and SEMs (CTB, n = 2–6 hemispheres; GFP, n = 2–11). For each hemisphere, estimates of spatial extent were based on 3–5 successive 70-μm-thick sections through the middle of dLGN and are expressed as a percentage of the total area of dLGN. Corticogeniculate innervation was delayed compared with retinogeniculate innervation, with most of the innervation occurring after the recession and segregation of uncrossed retinogeniculate projections. Measurements of uncrossed retinogeniculate projections were obtained from wild-type C57BL/6 (n = 31 hemispheres) and golli-τ-GFP mice (n = 17 hemispheres). Because there was no difference in the spatial extent of ipsilateral retinogeniculate projections between these two strains (Kolmogorov–Smirnov, Z = 0.459, p = 1), data from both wild-type C57BL/6 and golli-τ-GFP mice were combined.
Figure 5.
Figure 5.
Development of functional corticogeniculate synapses in dLGN. AD, Coronal sections showing VGlut1 immunofluorescence and τ-GFP expressing corticogeniculate projections in dLGN at P7 (A,B) and P14 (C,D). Left panels in A and C show merged images of τ-GFP (green) and VGlut1 (red). τ-GFP and VGlut1 are shown separately in the middle and right panels. Scale bar, 200 μm. B, D, High-magnification confocal images of VGlut1 staining from A, C, respectively. The image in B corresponds to a region in dLGN that was occupied by τ-GFP expressing axons. Scale bar, 35 μm. E, Acute in vitro thalamic slice preparation. Left: Example of a 300-μm-thick parasagittal slice of dLGN from a golli-τ-GFP mouse. Images are from the same section that was postfixed overnight after in vitro recording and show corticogeniculate projections expressing τ-GFP (top, green) and retinogeniculate projections labeled with CTB (bottom, red). Right: Schematic of the slice preparation. Also shown is the recording electrode (white) in dLGN and bipolar stimulating electrode (black) placed in the thalamic reticular nucleus (TRN), where corticothalamic axons pass before innervating dLGN. D indicates dorsal; A, anterior; OT, optic tract; M, medial geniculate nucleus. Scale bar, 100 μm. F, Examples of EPSPs evoked by paired electrical pulses delivered to corticothalamic fibers at three different age groups. G, Plots showing the mean PPR at different ISIs for P7 (n = 10), P15–P16 (n = 10), and P21–P45 (n = 15) cells. Error bars represent SEM. H, Summary plot showing the average PPR seen with an ISI of 100 ms during the first few postnatal weeks. The degree of facilitation was significantly higher at the second and third postnatal weeks compared with the first postnatal week (*p < 0.01). Error bars represent SEM.
Figure 6.
Figure 6.
Rate of corticogeniculate innervation in dLGN relies on retinogeniculate innervation. A, Coronal sections of dLGN showing corticogeniculate innervation (τ-GFP) at P3 (top) and P7 (bottom) in controls (left panels), after binocular enucleation (BE) at birth (middle panels), and in math5−/− mice (right panels). Scale bar, 100 μm. B, Summary graph plotting the mean percent area in dLGN occupied by corticogeniculate projections as a function of age in control (green), BE (magenta), and math5−/− (black) mice. Shown are means and SEMs (control, n = 4–11 hemispheres; BE, n = 4–12; math5−/−, n = 2–6). For each hemisphere, estimates of spatial extent were based on 3–5 successive 70-μm-thick sections through the middle of dLGN and are expressed as a percentage of the total area of dLGN. Compared with controls, the loss of retinal input accelerated the rate of corticogeniculate innervation. C, Summary graph for the multithreshold analysis plotting the mean percent area in dLGN occupied by corticogeniculate projections at P7 for control and math5−/− mice. Shown are means and SEMs (control, n = 5 hemispheres; math5−/−, n = 4).
Figure 7.
Figure 7.
Development of functional corticogeniculate synapses in dLGN in the absence of retinal input. AD, Coronal sections from P7 (A,B) and P14 (C,D) math5−/− mice showing VGlut1 staining and τ-GFP in dLGN. Left panels in A and C show merged images of τ-GFP (green) and VGlut1 (red). τ-GFP and VGlut1 are shown separately in the middle and right panels. Scale bar, 200 μm. B, D, High-magnification confocal images of VGlut1 staining from dLGN in A and C. Scale bar, 35 μm. The expression pattern of VGlut1 in math5−/− mice at P7 and P14 is comparable to that seen for age-matched controls (Fig. 5A–D). E, F, Example of EPSPs evoked by paired electrical pulses delivered to corticothalamic fibers in cells from math5−/− mice at P7 (E) and P14 (F).
Figure 8.
Figure 8.
Effects of monocular enucleation on the rate of corticogeniculate innervation in dLGN. A, Coronal sections showing both hemispheres from P3 (left) and P7 (right) golli-τ-GFP mice after ME at birth. One eye was removed and the spared eye was injected with CTB. The schematic above the panels depicts the spared (red) and removed (gray) eyes in relation to crossed and uncrossed projections in hemispheres of dLGN contralateral (contra) and ipsilateral (ipsi) to the enucleated eye. Top: CTB-labeled retinogeniculate projections from the remaining eye. Bottom: Corticogeniculate projections (τ-GFP). Scale bar, 100 μm. B, Summary graph plotting the mean percent area in dLGN occupied by corticogeniculate projections as a function of age in control (green), binocularly enucleated (BE, magenta, see also Fig. 6B), and monocularly enucleated mice (dLGN contralateral to the enucleated eye, ME (contra), dark gray; dLGN contralateral to the spared eye, ME (ipsi), gray). Shown are means and SEMs (control, n = 5–8 hemispheres; BE, n = 4–12; ME, n = 2–5). For each hemisphere, estimates of spatial extent were based on 3–5 successive 70-μm-thick sections through the middle of dLGN and are expressed as a percentage of the total area of dLGN. Accelerated corticogeniculate innervation was evident in the hemisphere contralateral to the enucleated eye, where uncrossed retinogeniculate projections are spared. Corticogeniculate innervation in dLGN ipsilateral to the enucleated eye was similar to controls.

Similar articles

Cited by

References

    1. Alexander GM, Godwin DW. Presynaptic inhibition of corticothalamic feedback by metabotropic glutamate receptors. J Neurophysiol. 2005;94:163–175. doi: 10.1152/jn.01198.2004. - DOI - PubMed
    1. Anderson G, Price DJ. Layer-specific thalamocortical innervation in organotypic cultures is prevented by substances that alter neural activity. Eur J Neurosci. 2002;16:345–349. doi: 10.1046/j.1460-9568.2002.02069.x. - DOI - PubMed
    1. Andrews W, Liapi A, Plachez C, Camurri L, Zhang J, Mori S, Murakami F, Parnavelas JG, Sundaresan V, Richards LJ. Robo1 regulates the development of major axon tracts and interneuron migration in the forebrain. Development. 2006;133:2243–2252. doi: 10.1242/dev.02379. - DOI - PubMed
    1. Anker RL. The prenatal development of some of the visual pathways in the cat. J Comp Neurol. 1977;173:185–204. doi: 10.1002/cne.901730111. - DOI - PubMed
    1. Bellocchio EE, Reimer RJ, Fremeau RT, Jr, Edwards RH. Uptake of glutamate into synaptic vesicles by an inorganic phosphate transporter. Science. 2000;289:957–960. doi: 10.1126/science.289.5481.957. - DOI - PubMed

Publication types

MeSH terms

Substances

LinkOut - more resources