. 2013 Jul 26;288(30):21987-98.
doi: 10.1074/jbc.M113.469205. Epub 2013 Jun 11.

α-Amino-3-hydroxy-5-methyl-4-isoxazole propionic acid (AMPA) and N-methyl-D-aspartate (NMDA) receptors adopt different subunit arrangements

Affiliations

α-Amino-3-hydroxy-5-methyl-4-isoxazole propionic acid (AMPA) and N-methyl-D-aspartate (NMDA) receptors adopt different subunit arrangements

Dilshan Balasuriya et al. J Biol Chem. .

Abstract

Ionotropic glutamate receptors are widely distributed in the central nervous system and play a major role in excitatory synaptic transmission. All three ionotropic glutamate subfamilies (i.e. AMPA-type, kainate-type, and NMDA-type) assemble as tetramers of four homologous subunits. There is good evidence that both heteromeric AMPA and kainate receptors have a 2:2 subunit stoichiometry and an alternating subunit arrangement. Recent studies based on presumed structural homology have indicated that NMDA receptors adopt the same arrangement. Here, we use atomic force microscopy imaging of receptor-antibody complexes to show that whereas the GluA1/GluA2 AMPA receptor assembles with an alternating (i.e. 1/2/1/2) subunit arrangement, the GluN1/GluN2A NMDA receptor adopts an adjacent (i.e. 1/1/2/2) arrangement. We conclude that the two types of ionotropic glutamate receptor are built in different ways from their constituent subunits. This surprising finding necessitates a reassessment of the assembly of these important receptors.

Keywords: Atomic Force Microscopy; Cell Surface Receptor; Glutamate Receptors, Ionotropic (AMPA, NMDA); Protein Complexes; Single-particle Analysis.


Figures
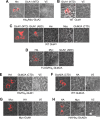
FIGURE 1.
FIGURE 1.
Demonstration of antibody specificity. tsA 201 cells expressing His8/Myc-GluA2 (A), WT GluA1 (B), WT GluN1 (C), FLAG/His8-GluN2A (D), HA/His8-GluN1 (E), WT GluN2A (F), Myc-GluN1 (G), and HA/His8-GluN2A (H) were fixed, permeabilized, and probed with monoclonal antibodies to the targets indicated above each panel, followed by appropriate Cy3-conjugated goat secondary antibody. Cells were imaged by confocal microscopy, and the fluorescence and brightfield channels were superimposed. Scale bar, 50 μm. The relevant figures in the paper are: A, Fig. 2; B, Figs. 3 and 7; C, Figs. 4 and 8; D, Figs. 5 and 8; E–H, Fig. 6.
FIGURE 2.
FIGURE 2.
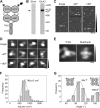
Subunit arrangement in the total cellular pool of homomeric GluA2 AMPA receptors. A, schematic illustration of a GluA2 AMPA receptor subunit homodimer, with the location of the tag (His8/Myc) used to isolate the receptor indicated by the arrow and the site of antibody decoration (NTD) indicated by the asterisk. Numbers refer to the subunit used (GluA2). B, silver-stained gel of the isolated protein (left) showing a single major band at a molecular mass of ∼100 kDa (arrow). The isolated protein was also analyzed by immunoblotting using an anti-Myc antibody (GluA2, right). A single immunopositive band is seen, again at ∼100 kDa. Molecular mass markers (kDa) are shown at the right. C, low magnification AFM images of AMPA receptors that had been incubated with anti-His antibodies. Arrows indicate single-decorated receptors (left) or receptors decorated by two antibodies at either ∼90° (center) or ∼180° (right). Scale bar, 200 nm; height scale, 0–4 nm. D, gallery of enlarged images showing AMPA receptors after incubation with anti-His antibody. The gallery shows single-decorated receptors (top) or receptors decorated by two antibodies at either ∼90° (middle) or ∼180° (bottom). Scale bar, 20 nm; height scale, 0–3 nm. E, examples of receptors decorated by either three (left) or four antibodies (right). Scale bar, 20 nm; height scale, 0–3 nm. F, frequency distribution of molecular volumes of the central antibody-decorated particles. The curve indicates the fitted Gaussian function. The peak of the distribution (±S.E.) is indicated. G, frequency distribution of angles between pairs of bound antibodies. The antibody decoration patterns consistent with data are shown in the insets.
FIGURE 3.
FIGURE 3.
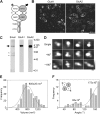
Subunit arrangement in the total cellular pool of heteromeric GluA1/GluA2 AMPA receptors. A, schematic illustration of a GluA1/GluA2 AMPA receptor subunit heterodimer, with the location of the tag (His8/Myc) on GluA2 used to isolate the receptor indicated by the arrow, and the site of antibody decoration (NTD of GluA1) indicated by the asterisk. Numbers refer to the subunits used (GluA1 and GluA2). B, immunofluorescence analysis of protein expression. Cells expressing WT GluA1 plus Myc/His8-GluA2 were fixed, permeabilized, and incubated with mouse monoclonal anti-GluA1 and rabbit polyclonal anti-His primary antibodies followed by FITC-conjugated anti-mouse and Cy3-conjugated anti-rabbit secondary antibodies. Scale bar, 50 μm. C, silver-stained gel of the isolated protein (left) showing a doublet at a molecular mass of ∼100 kDa (arrows). The asterisks indicate bands that appeared even in blank lanes and so are likely contaminants in the gel and not in the protein sample. The isolated protein was also analyzed by immunoblotting using anti-GluA1 (center) or anti-Myc antibodies (GluA2, right). Both antibodies revealed single immunopositive bands at ∼100 kDa. D, gallery of enlarged images showing AMPA receptors after incubation with anti-GluA1 antibody. The gallery shows single-decorated receptors (top) or receptors decorated by two antibodies at either ∼90° (center) or ∼180° (bottom). Scale bar, 20 nm; height scale, 0–3 nm. E, frequency distribution of molecular volumes of the central antibody-decorated particles. The curve indicates the fitted Gaussian function. The peak of the distribution is indicated. F, frequency distribution of angles between pairs of bound antibodies. The predominant subunit arrangement revealed by the data is shown in the inset.
FIGURE 4.
FIGURE 4.
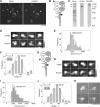
Arrangement of GluN1 subunits in GluN1/GluN2A NMDA receptors isolated from the total cellular pool. A, immunofluorescence analysis of protein expression. Cells expressing WT GluN1 plus FLAG/His8-GluN2A were fixed, permeabilized, and incubated with mouse monoclonal anti-GluN1 (ABD) and rabbit monoclonal anti-GluN2A primary antibodies followed by FITC-conjugated anti-mouse and Cy3-conjugated anti-rabbit secondary antibodies. Scale bar, 50 μm. B, schematic illustration of a GluN1/GluN2A NMDA receptor subunit heterodimer, with the location of the tag (FLAG/His8) used to isolate the receptor indicated by the arrow, and the site of anti-GluN1 antibody decoration (NTD) indicated by the asterisk. Numbers refer to the subunits used (GluN1 and GluN2A). C, silver-stained gel of the isolated protein (left) showing the presence of bands at ∼120 and ∼180 kDa (arrows). Immunoblotting using anti-subunit antibodies indicated that these two bands were GluN1 and GluN2A, respectively (center and right). D, gallery of enlarged images showing receptors after incubation with anti-GluN1 (NTD) antibody. The gallery shows single- (upper) and double-decorated receptors (lower). Scale bar, 20 nm; height scale, 0–3 nm. E, frequency distribution of molecular volumes of the central particles decorated by anti-GluN1 (NTD) antibodies. The curve indicates the fitted Gaussian function. The peak of the distribution is indicated. F, frequency distribution of angles between pairs of bound antibodies. The subunit arrangement revealed by the data is shown in the inset. G, schematic illustration of a GluN1/GluN2A NMDA receptor subunit heterodimer, with the location of the tag (FLAG/His8) used to isolate the receptor indicated by the arrow, and the site of anti-GluN1 antibody decoration (ABD) indicated by the asterisk. H, gallery of enlarged images showing receptors after incubation with anti-GluN1 (ABD) antibody. The gallery shows single- (upper) and double-decorated receptors (lower). Scale bar, 20 nm; height scale, 0–3 nm. I, frequency distribution of molecular volumes of the central particles decorated by anti-GluN1 (ABD) antibodies. J, frequency distribution of angles between pairs of bound antibodies. The subunit arrangement revealed by the data is shown in the inset. K, gallery of images of double-decorated receptors integrated into supported lipid bilayers and imaged under fluid. Bound antibodies are indicated by the arrowheads. Scale bar, 100 nm; height range, 20 nm.
FIGURE 5.
FIGURE 5.
Arrangement of GluN2A subunits in GluN1/GluN2A NMDA receptors isolated from the total cellular pool. A, schematic illustration of a GluN1/GluN2A NMDA receptor subunit heterodimer, with the location of the tag (FLAG/His8) used to isolate the receptor indicated by the arrow, and the site of anti-His antibody decoration (post-TMD) indicated by the asterisk. Numbers refer to the subunits used (GluN1 and GluN2A). B, gallery of enlarged images showing receptors after incubation with anti-His antibody. The gallery shows single- (upper) and double-decorated receptors (lower). Scale bar, 20 nm; height scale, 0–3 nm. C, frequency distribution of molecular volumes of the central particles decorated by anti-His antibodies. The curve indicates the fitted Gaussian function. The peak of the distribution is indicated. D, frequency distribution of angles between pairs of bound antibodies. The subunit arrangement revealed by the data is shown in the inset.
FIGURE 6.
FIGURE 6.
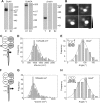
Antibody decoration of additional epitope-tagged NMDA receptors isolated from the total cellular pool. A and B, schematic illustration of a GluN1/GluN2A NMDA receptor subunit heterodimer, with the location of the tag (HA/His8) used to isolate the receptor indicated by the arrow, and the sites of antibody decoration (A, anti-HA (ABD), and B, anti-GluN2A (CTD)) indicated by the asterisk. Numbers refer to the subunits used (GluN1 and GluN2A). C, frequency distribution of angles between pairs of bound anti-HA antibodies. The curve indicates the fitted Gaussian function. The peak of the distribution is indicated. D, frequency distribution of angles between pairs of bound anti-GluN2A antibodies. E and F, schematic illustration of a GluN1/GluN2A NMDA receptor subunit heterodimer, with the location of the tag (HA/His8) used to isolate the receptor indicated by the arrow, and the sites of antibody decoration (E, anti-Myc (ABD), and F, anti-HA (ABD)) indicated by the asterisk. G, frequency distribution of angles between pairs of bound anti-Myc antibodies. H, frequency distribution of angles between pairs of bound anti-HA antibodies. For each distribution, the subunit arrangement revealed by the data is shown in the inset.
FIGURE 7.
FIGURE 7.
Subunit arrangement in cell surface GluA1/GluA2 AMPA receptors. A, protein eluted from monomeric avidin-agarose by biotin (E1) and from anti-Myc-agarose by Myc peptide (E2) was analyzed by immunoblotting using anti-GluA1 (left), anti-Myc (GluA2, center), or anti-β-actin antibodies (right). The right panel also shows an immunoblot of the total cell extract (T). B, gallery of enlarged images showing receptors double decorated by anti-GluA1 (NTD) antibodies. Scale bar, 20 nm; height scale, 0–3 nm. C, frequency distribution of molecular volumes of the central antibody-decorated particles. The curve indicates the fitted Gaussian function. The peak of the distribution is indicated. D, frequency distribution of angles between pairs of bound antibodies. The subunit arrangement revealed by the data is shown in the inset.
FIGURE 8.
FIGURE 8.
Subunit arrangement in cell surface GluN1/GluN2A NMDA receptors. A, protein eluted from monomeric avidin-agarose by biotin (E1) and from anti-FLAG-agarose by triple-FLAG peptide (E2) was analyzed by immunoblotting using anti-GluN1 (left), anti-GluN2A (center), or anti-β-actin antibodies (right). The right panel also shows an immunoblot of the total cell extract (T). B, gallery of enlarged images showing receptors double decorated by anti-GluN1 (ABD) antibodies. Scale bar, 20 nm; height scale, 0–3 nm. C, schematic illustration of a GluN1/GluN2A NMDA receptor subunit heterodimer, with the location of the tag (FLAG/His8) used to isolate the receptor indicated by the arrow, and the site of anti-GluN1 antibody decoration (ABD) indicated by the asterisk. Numbers refer to the subunits used (GluN1 and GluN2A). D, frequency distribution of molecular volumes of the central particles decorated by anti-GluN1 antibodies. The curve indicates the fitted Gaussian function. The peak of the distribution is indicated. E, frequency distribution of angles between pairs of bound antibodies. The subunit arrangement revealed by the data is shown in the inset. F, schematic illustration of a GluN1/GluN2A NMDA receptor subunit heterodimer, with the location of the tag used to isolate the receptor indicated by the arrow, and the site of anti-His antibody decoration (post-TMD) indicated by the asterisk. G, frequency distribution of molecular volumes of the central particles decorated by anti-His antibodies. H, frequency distribution of angles between pairs of bound antibodies. The subunit arrangement revealed by the data is shown in the inset.
FIGURE 9.
FIGURE 9.
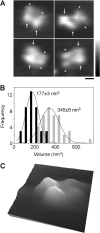
Structure of partially dissociated GluN1/GluN2A NMDA receptors. A, examples of structures composed of four particles that are likely GluN1/GluN2A receptors that have attached to the mica intact and then partially dissociated. Adjacent small and large particles are indicated by arrowheads and arrows, respectively. Scale bar, 100 nm; height scale, 0–3 nm. B, frequency distribution of molecular volumes of individual small (black bars) and large particles (gray bars) within four-particle clusters. The curves indicate the fitted Gaussian functions. The means of the distributions are indicated. C, three-dimensional representation of a partially dissociated NMDA receptor. The image is 80 nm square.

Similar articles

Cited by

References

    1. Traynelis S. F., Wollmuth L. P., McBain C. J., Menniti F. S., Vance K. M., Ogden K. K., Hansen K. B., Yuan H., Myers S. J., Dingledine R. (2010) Glutamate receptor ion channels: structure, regulation, and function. Pharmacol. Rev. 62, 405–496 - PMC - PubMed
    1. Mayer M. L. (2011) Emerging models of glutamate receptor ion channel structure and function. Structure 19, 1370–1380 - PMC - PubMed
    1. Mansour M., Nagarajan N., Nehring R. B., Clements J. D., Rosenmund C. (2001) Heteromeric AMPA receptors assemble with a preferred subunit stoichiometry and spatial arrangement. Neuron 32, 841–853 - PubMed
    1. Kumar J., Schuck P., Mayer M. L. (2011) Structure and assembly mechanism for heteromeric kainate receptors. Neuron 71, 319–331 - PMC - PubMed
    1. Schorge S., Colquhoun D. (2003) Studies of NMDA receptor function and stoichiometry with truncated and tandem subunits. J. Neurosci. 23, 1151–1158 - PMC - PubMed

Publication types

MeSH terms

Substances

LinkOut - more resources