Pathview: an R/Bioconductor package for pathway-based data integration and visualization
- PMID: 23740750
- PMCID: PMC3702256
- DOI: 10.1093/bioinformatics/btt285
Pathview: an R/Bioconductor package for pathway-based data integration and visualization
Abstract
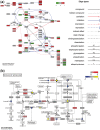
Summary: Pathview is a novel tool set for pathway-based data integration and visualization. It maps and renders user data on relevant pathway graphs. Users only need to supply their data and specify the target pathway. Pathview automatically downloads the pathway graph data, parses the data file, maps and integrates user data onto the pathway and renders pathway graphs with the mapped data. Although built as a stand-alone program, Pathview may seamlessly integrate with pathway and functional analysis tools for large-scale and fully automated analysis pipelines.
Availability: The package is freely available under the GPLv3 license through Bioconductor and R-Forge. It is available at http://bioconductor.org/packages/release/bioc/html/pathview.html and at http://Pathview.r-forge.r-project.org/.
Contact: luo_weijun@yahoo.com
Supplementary information: Supplementary data are available at Bioinformatics online.
Figures

Similar articles
-
Pathview Web: user friendly pathway visualization and data integration.Nucleic Acids Res. 2017 Jul 3;45(W1):W501-W508. doi: 10.1093/nar/gkx372. Nucleic Acids Res. 2017. PMID: 28482075 Free PMC article.
-
LedPred: an R/bioconductor package to predict regulatory sequences using support vector machines.Bioinformatics. 2016 Apr 1;32(7):1091-3. doi: 10.1093/bioinformatics/btv705. Epub 2015 Dec 1. Bioinformatics. 2016. PMID: 26628586
-
HilbertCurve: an R/Bioconductor package for high-resolution visualization of genomic data.Bioinformatics. 2016 Aug 1;32(15):2372-4. doi: 10.1093/bioinformatics/btw161. Epub 2016 Mar 24. Bioinformatics. 2016. PMID: 27153599
-
spicyR: spatial analysis of in situ cytometry data in R.Bioinformatics. 2022 May 26;38(11):3099-3105. doi: 10.1093/bioinformatics/btac268. Bioinformatics. 2022. PMID: 35438129 Free PMC article. Review.
-
Visualization of proteomics data using R and bioconductor.Proteomics. 2015 Apr;15(8):1375-89. doi: 10.1002/pmic.201400392. Proteomics. 2015. PMID: 25690415 Free PMC article. Review.
Cited by
-
Deciphering Immunotoxicity in Animal-Derived Biomaterials: A Genomic and Bioinformatics Approach.Int J Mol Sci. 2024 Oct 11;25(20):10963. doi: 10.3390/ijms252010963. Int J Mol Sci. 2024. PMID: 39456747 Free PMC article.
-
Heavy water inhibits DNA double-strand break repairs and disturbs cellular transcription, presumably via quantum-level mechanisms of kinetic isotope effects on hydrolytic enzyme reactions.PLoS One. 2024 Oct 3;19(10):e0309689. doi: 10.1371/journal.pone.0309689. eCollection 2024. PLoS One. 2024. PMID: 39361575 Free PMC article.
-
Fructose stimulated de novo lipogenesis is promoted by inflammation.Nat Metab. 2020 Oct;2(10):1034-1045. doi: 10.1038/s42255-020-0261-2. Epub 2020 Aug 24. Nat Metab. 2020. PMID: 32839596 Free PMC article.
-
Construction of a combined random forest and artificial neural network diagnosis model to screening potential biomarker for hepatoblastoma.Pediatr Surg Int. 2022 Dec;38(12):2023-2034. doi: 10.1007/s00383-022-05255-3. Epub 2022 Oct 22. Pediatr Surg Int. 2022. PMID: 36271952
-
Environmental regulation of male fertility is mediated through Arabidopsis transcription factors bHLH89, 91, and 10.J Exp Bot. 2024 Mar 27;75(7):1934-1947. doi: 10.1093/jxb/erad480. J Exp Bot. 2024. PMID: 38066689 Free PMC article.
References
-
- Ellson J, et al. Graphviz—open source graph drawing tools. In: Mutzel P, Jünger M, Leipert S, editors. Graph Drawing. Berlin Heidelberg: Springer; 2002. pp. 483–484.
Publication types
MeSH terms
LinkOut - more resources
Full Text Sources
Other Literature Sources
Molecular Biology Databases

