. 2013 Jul;140(14):2867-78.
doi: 10.1242/dev.088096. Epub 2013 Jun 5.

Polycomb repressive complex PRC2 regulates Xenopus retina development downstream of Wnt/β-catenin signaling

Affiliations

Polycomb repressive complex PRC2 regulates Xenopus retina development downstream of Wnt/β-catenin signaling

Issam Aldiri et al. Development. 2013 Jul.

Abstract

The histone methyltransferase complex PRC2 controls key steps in developmental transitions and cell fate choices; however, its roles in vertebrate eye development remain unknown. Here, we report that in Xenopus, PRC2 regulates the progression of retinal progenitors from proliferation to differentiation. We show that the PRC2 core components are enriched in retinal progenitors and downregulated in differentiated cells. Knockdown of the PRC2 core component Ezh2 leads to reduced retinal progenitor proliferation, in part due to upregulation of the Cdk inhibitor p15(Ink4b). In addition, although PRC2 knockdown does not alter eye patterning, retinal progenitor gene expression or expression of the neural competence factor Sox2, it does cause suppression of proneural bHLH gene expression, indicating that PRC2 is crucial for the initiation of neural differentiation in the retina. Consistent with this, knocking down or blocking PRC2 function constrains the generation of most retinal neural cell types and promotes a Müller glial cell fate decision. We also show that Wnt/β-catenin signaling acting through the receptor Frizzled 5, but independent of Sox2, regulates expression of key PRC2 subunits in the developing retina. This is consistent with a role for this pathway in coordinating proliferation and the transition to neurogenesis in the Xenopus retina. Our data establish PRC2 as a regulator of proliferation and differentiation during eye development.

Keywords: Epigenetics; Ezh2; Histone methylation; Neurogenesis; Retina development; Wnt signaling.


Figures

Fig. 1.
Fig. 1.
The PRC2 core components are enriched in the CMZ region of Xenopus retina. (A) Stage 41 frog embryo. (B) Domains in the ciliary marginal zone (CMZ) of the Xenopus retina at stage 41. (C-F) Expression of Ezh2, Suz12, Eed and Rbbp4 by in situ hybridization on retinal sections. Retinal stem cell domain in the distal tip of the CMZ is negative for staining (bracket in D provides an example). (G-I) Ezh2 expression coincides with BrdU labeling. (J-L) EZH2 protein is enriched in the CMZ. RPE, retinal pigment epithelium.
Fig. 2.
Fig. 2.
Ezh2 is required for H3K27me3 deposition in Xenopus retina. (A-C) Immunostaining of H3K27me3 on a stage 41 retinal section showing increased labeling in differentiated cells. (D-I) Immunostaining of H3K27me3 after co-injection of GFP mRNA with Ezh2 ATG MO (D-F) or control MO (G-I). Arrowheads in D-F show GFP-labeled cells with reduced H3K27me3 levels, whereas in G-I the arrowheads indicate GFP-labeled cells with normal H3K27 staining. Hoechst labels nuclei (blue). INL, inner nuclear layer; GCL, ganglion cell layer. Scale bars: 10 μm.
Fig. 3.
Fig. 3.
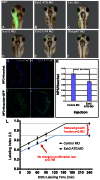
Inhibition of PRC2 function negatively affects retinal proliferation. (A-F) Knockdown of PRC2 core components causes reduced eye size (n=103/117 for Ezh2 ATG MO; 6/36 for Ezh2 UTR MO; 19/24 for Rbbp4/7 MO; 14/34 for Suz12 MO), whereas control MO does not (C; n=44). (G-J) Injection of Ezh2 ATG MO results in reduced fraction of HP3-labeled cells within the optic vesicle (H,J) when compared with control MO (G,I). Scale bars: 50 μm. (K) Quantification of data represented in G-J (n=12 embryos for control MO, n=10 embryos for Ezh2 MO embryos). Data are mean±s.e.m., Student’s t-test, **P<0.01. (L) Cumulative BrdU labeling in the optic vesicle with Ezh2 ATG MO or control MO injection together with GFP mRNA. The labeling index (LI) is the number of BrdU-labeled nuclei over total Hoechst-positive nuclei in the optic vesicle. The slope of the initial linear increase in BrdU labeling in both conditions was similar (P=0.756), which reflects no change in proliferation rate and cell cycle length. There was a significant decrease in the maximum BrdU labeling attained with Ezh2 ATG MO (LI=0.695) when compared with control MO (LI=0.945, P<0.001); thus, the growth fraction (the proportion of cells in the optic vesicle that are cycling) is reduced. Data are mean±s.e.m.
Fig. 4.
Fig. 4.
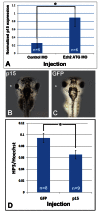
Ezh2 knockdown increases p15Ink4b expression and p15Ink4b causes reduced proliferation. (A) Quantification of p15Ink4b expression by semi-quantitative PCR analysis of isolated optic vesicle tissue after either control MO or Ezh2 ATG MO injection, normalized to the internal standard histone H4. n=5 for control MO, n=6 for Ezh2 ATG MO. (B,C) p15Ink4b overexpression by mRNA injection at the eight-cell stage causes a small eye phenotype (n=35/39) when compared with injection of GFP mRNA alone. Asterisk marks injected side. (D) p15Ink4b overexpression results in reduced HP3 labeling in the optic vesicle when compared with GFP alone. In A,D, data are mean±s.e.m.; Student’s t-test, *P<0.05.
Fig. 5.
Fig. 5.
Knockdown of Ezh2 does not affect retinal progenitor specification. (A-G) Anterior view of stage 20 embryos after injection of Ezh2 ATG MO and mRNA encoding β-galactosidase to label the injected side. X-gal staining is light blue. Progenitor genes show normal levels of expression, although the eye domain is smaller (embryos with a reduced expression domain: 70%, n=90 for Rx; 85%, n=47 for Pax6; 81%, n=43 for Six3; 82%, n=74 for Vsx1; 82%, n=76 for Fz5; 81%, n=62 for Sox2; 81%, n=16 for cyclin D1). (H,I) Control MO-injected embryos.
Fig. 6.
Fig. 6.
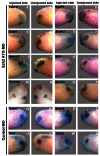
Initiation of retinal differentiation genes is blocked by Ezh2 inhibition. Lateral view of embryos injected with Ezh2 ATG or control MOs along with β-galactosidase or GFP mRNAs to mark injected side. X-gal staining is light blue. (A-J) Proneural bHLH gene expression is reduced or absent after Ezh2 ATG MO injection (55%, n=53 for Xath5; 57%, n=52 for Xash1; 47%, n=19 for NeuroD; 40%, n=16 for Xash3; 43%, n=30 for NgnR1). (K-P) The bHLH target gene Sbt1 (K,L; 67%, n=14) and the ganglion cell marker Hermes (M,N; 84%, n=31) are reduced or absent, whereas Rx expression level is normal (O,P). (Q-X) Control MO has minimal effect (n=28 for Xash1; n=21 for Xash3; n=15 for Xath5; n=14 for Sbt1).
Fig. 7.
Fig. 7.
Inhibiting PRC2 function in retinal progenitors biases cells to adopt the Müller glial cell fate. (A) Injection of Ezh2 MO (ATG MO) caused a sevenfold increase in the proportion of cells that become Müller glia when compared with GFP alone or with control MO [25.6±1.5% (s.e.m.), n=2065 cells total, 11 retinas for Ezh2 ATG MO; 3.6±0.37%, n=3574 cells total, 11 retinas for GFP mRNA alone, P<0.001; 5.6±0.51%, n=2699 cells total, 10 retinas, for control MO, no significant difference, P=0.06 compared with GFP mRNA alone]. Injection of Ezh2 UTR MO (UTR MO) had a similar effect [24.5±2.04% (s.e.m.), n=2125 cells, 9 retinas, P<0.001] as did injection of ΔSET-Ezh2 mRNA [ΔSET; 36.2±2.2% (s.e.m.), n=3782 cells, 17 retinas, P<0.001]. The percent representation of each cell type is a weighted average, and error bars represent s.e.m.; *P<0.001, by Student’s t-test. (B) Confocal image of a retinal section (stage 41) showing Hoechst-labeled retinal cells (blue) and GFP-labeled cells (green) from an embryo injected with Ezh2 UTR MO plus GFP mRNA. ONL, outer nuclear layer; INL, inner nuclear layer; GCL, ganglion cell layer. Scale bar: 20 μm.
Fig. 8.
Fig. 8.
Wnt signaling is required for PRC2 subunit expression and H3K27me3 in the retina. (A-D) Fz5 MO-injected embryos showing reduced expression of Suz12 (A,B; 51%, n=55) and Ezh2 (C,D; 44%, n=41) within the eye on the injected side. (E,F) Rx:ΔNTcf3-GFP transgenic embryos showing loss of Ezh2 and Xath5 expression in the eye. Embryos with normal expression are shown in the inset. (G,H) Anterior view of Rx:Sox2-BD transgenic embryos showing normal Ezh2 expression while Xath5 expression is lost. Inset in H shows an embryo with normal Xath5 expression. (I) A high proportion of dnTCF transgenic embryos have reduced or absent retinal expression of Xath5, Suz12 or Ezh2, whereas for Sox2-BD transgenic embryos, only Xath5 is affected. Total numbers of embryos analyzed for each are indicated on the bars of the graph. (J,K) Immunostaining with antibody against H3K27me3 on a retinal section from a stage 41 embryo injected with Fz5 MO plus GFP mRNA. Hoechst labels nuclei (blue). Arrowheads indicate GFP-labeled cells with reduced H3K27me3 levels. INL, inner nuclear layer; GCL, ganglion cell layer; Tg, transgenic. Scale bar: 20 μm.

Similar articles

Cited by

References

    1. Agathocleous M., Harris W. A. (2009). From progenitors to differentiated cells in the vertebrate retina. Annu. Rev. Cell Dev. Biol. 25, 45–69 - PubMed
    1. Agathocleous M., Iordanova I., Willardsen M. I., Xue X. Y., Vetter M. L., Harris W. A., Moore K. B. (2009). A directional Wnt/beta-catenin-Sox2-proneural pathway regulates the transition from proliferation to differentiation in the Xenopus retina. Development 136, 3289–3299 - PMC - PubMed
    1. Aguilo F., Zhou M. M., Walsh M. J. (2011). Long noncoding RNA, polycomb, and the ghosts haunting INK4b-ARF-INK4a expression. Cancer Res. 71, 5365–5369 - PMC - PubMed
    1. Akizu N., Estarás C., Guerrero L., Martí E., Martínez-Balbás M. A. (2010). H3K27me3 regulates BMP activity in developing spinal cord. Development 137, 2915–2925 - PubMed
    1. Akkers R. C., van Heeringen S. J., Jacobi U. G., Janssen-Megens E. M., Françoijs K. J., Stunnenberg H. G., Veenstra G. J. (2009). A hierarchy of H3K4me3 and H3K27me3 acquisition in spatial gene regulation in Xenopus embryos. Dev. Cell 17, 425–434 - PMC - PubMed

Publication types