. 2013 Oct 1;22(19):3947-59.
doi: 10.1093/hmg/ddt249. Epub 2013 Jun 4.

Mitochondrial damage revealed by immunoselection for ALS-linked misfolded SOD1

Mitochondrial damage revealed by immunoselection for ALS-linked misfolded SOD1

Sarah Pickles et al. Hum Mol Genet. .

Abstract

Mutant superoxide dismutase 1 (SOD1) selectively associates with spinal cord mitochondria in rodent models of SOD1-mediated amyotrophic lateral sclerosis. A portion of mutant SOD1 exists in a non-native/misfolded conformation that is selectively recognized by conformational antibodies. Misfolded SOD1 is common to all mutant SOD1 models, is uniquely found in areas affected by the disease and is considered to mediate toxicity. We report that misfolded SOD1 recognized by the antibody B8H10 is present in greater abundance in mitochondrial fractions of SOD1(G93A) rat spinal cords compared with oxidized SOD1, as recognized by the C4F6 antibody. Using a novel flow cytometric assay, we detect an age-dependent deposition of B8H10-reactive SOD1 on spinal cord mitochondria from both SOD1(G93A) rats and SOD1(G37R) mice. Mitochondrial damage, including increased mitochondrial volume, excess superoxide production and increased exposure of the toxic BH3 domain of Bcl-2, tracks positively with the presence of misfolded SOD1. Lastly, B8H10 reactive misfolded SOD1 is present in the lysates and mitochondrial fractions of lymphoblasts derived from ALS patients carrying SOD1 mutations, but not in controls. Together, these results highlight misfolded SOD1 as common to two ALS rodent animal models and familial ALS patient lymphoblasts with four different SOD1 mutations. Studies in the animal models point to a role for misfolded SOD1 in mitochondrial dysfunction in ALS pathogenesis.


Conflict of interest statement

statement. None declared.

Figures

Figure 1
Figure 1
Preferential detection of B8H10 reactive misfolded SOD1 associated with mitochondria. The capacity of B8H10 and C4F6 antibodies to detect misfolded SOD1 was compared using mitochondrial and cytosolic protein fractions isolated from the spinal cord of symptomatic SOD1G93A rat or recombinant SOD1 using different conditions. (A) Immunoprecipitation of cytosolic or mitochondrial fractions from a symptomatic SOD1G93A rat with B8H10 or C4F6 misfolded SOD1-specific antibodies and blotted for SOD1. Input is 2 μg of each fraction. Upper and lower bands corresponds to human (hSOD1) and rat SOD1 (rSOD1), respectively. Experiment shown is representative of three independent trials. (B) Non-denaturing gel of cytosolic fraction (5 μg) or increasing amounts of the mitochondrial fraction (25, 50 and 80 μg) blotted with misfolded specific antibodies B8H10 and C4F6. Bottom: denaturing gel showing total amount of SOD1 present. Experiment shown is representative of three independent trials. (C) Non-denaturing gel of recombinant SOD1 proteins (6 μg) treated with EDTA or H2O2 to demonstrate specificity of the C4F6 antibody for SOD1G93A and oxidized SOD1WT proteins. Note the specificity of the C4F6 antibody for the SOD1G93A protein (1 min exposure) compared with the labelling of the SOD1WT protein (30 min exposure). Bottom: denaturing gel showing total SOD1present.(D) Immunoblotting of cellular fractions for VDAC andHsp70confirmed the identity of mitochondrial and cytosolic fractions, respectively.
Figure 2
Figure 2
Detection of mitochondrial-bound misfolded SOD1 by flow cytometry. Mitochondria were isolated from the spinal cord and liver of SOD1G93A, SOD1WT and non-transgenic rats and characterized by flow cytometry. (A) Isolated mitochondria are first gated by size (forward light scatter, FSC) and granularity (side scatter, SSC). (B) Mitochondria are then selected by staining with MTG (black, dashed) a mitochondrial-specific dye, compared with unstained control (grey, filled). (C) Mitochondria that label positive for B8H10 (B8H10+), compared with background labelling with isotype control (IgG1), are selected and mitochondrial function of the two subpopulations (B8H10+ versus B8H10) can then be compared. (D) Quantification of B8H10+ mitochondria derived from the spinal cord (black) or liver (white) of symptomatic SOD1G93A rats (18.0 ± 1.1 weeks) and age-matched SOD1WT (17.6 ± 0.8 weeks) and non-transgenic rats (16.9 ± 0.9 weeks). Data are represented as the percentage of B8H10+ mitochondria (mean ± SEM), n = 3 animals per genotype and tissue, ***P < 0.0001. (E) By flow cytometry, the amount of mitochondria labelled with the B8H10 antibody increases over time in spinal cord (black circle), but not liver (white square), samples derived from SOD1G93A rats. Animals with greater than 1% of mitochondria labelling positive for B8H10 (boxed) were included in the functional analysis. n = 4–7 animals per time point. (F) Weight curve of SOD1G93A female rats were weighed and evaluated bi-weekly (n = 4–10 per time point). (G) Disease onset and symptomatic phase for all SOD1G93A rats used in this study. In our colony, the onset of disease, as defined by reaching peak body weight, corresponds to 15.2 weeks (107 ± 1.5 days, n = 43) and the appearance of symptoms, namely gait defects, occurred at 18.0 weeks (126 ± 1.8 days, n = 42). Based on these observations, the association of misfolded SOD1 with mitochondria begins prior to disease onset.
Figure 3
Figure 3
Mitochondria with misfolded SOD1-associated have a greater mitochondrial volume. Mitochondria isolated from the spinal cords of SOD1G93A rats at different time points were characterized by flow cytometry. (A) Representative histogram of FSC of B8H10+ mitochondria (solid line) versus B8H10 mitochondria (dotted line) of a symptomatic SOD1G93A rat (B) Quantification of the geometric mean of FSC of B8H10+ mitochondria (black) and B8H10 mitochondria (white) relative to total population (mean ± SEM) at 14 and 15 weeks of age and symptomatic SOD1G93A rats. (C) Representative histogram of B8H10+ (solid line) and B8H10 (dotted line), mitochondria stained with MTG, compared with unstained control (grey, filled) of a symptomatic SOD1G93A rat. (D) ΔMFI of MTG staining of mitochondrial subpopulations relative to total population (mean ± SEM). ***P < 0.0001.
Figure 4
Figure 4
Mitochondria with misfolded SOD1-associated exhibit an increased production of mitochondrial superoxide but retain a normal transmembrane potential. Mitochondria isolated from the spinal cord of SOD1G93A at different time points were characterized by flow cytometry for superoxide production and mitochondrial transmembrane potential. (A) Mitochondrial superoxide can be assayed with MitoSOX Red. Addition of the complex III inhibitor AA causes an increase in superoxide production (dashed line), compared with basal levels (solid line), and unstained control (grey, filled). (B) Representative histogram of mitochondrial superoxide production of B8H10+ (solid line) and B8H10(dashed line) mitochondria from the spinal cord of a symptomatic SOD1G93A rat. (C) Quantification of the percentage of MitoSOX+ mitochondria in the B8H10+ (black) and B8H10 (white) populations, relative to MTG staining and the total mitochondrial population. (D) Representative dot plots demonstrating that the B8H10+ population has a higher percentage of larger mitochondria (as determined by FSC) that produce excessive mitochondrial superoxide (as measured by MitoSOX Red). (E) Histogram demonstrating that mitochondrial transmembrane potential can be assayed with TMRM. Under basal conditions, almost all mitochondria stain positive for TMRM (solid line), but transmembrane potential is dissipated with the addition of the protonophore CCCP (dashed lined). (F) Quantification of ΔMFI of TMRM staining of B8H10+ and B8H10 mitochondria relative to MTG staining and the total mitochondrial population. *P < 0.05; **P < 0.01.
Figure 5
Figure 5
Increased Bcl-2 BH3 domain exposure on mitochondria bearing misfolded SOD1. (A) Representative dot plot of spinal cord mitochondria from a symptomatic SOD1G93A rat labelled with a Bcl-2 antibody specific for the BH3 domain. The population labelling positive for the exposure of the BH3 domain (BH3+, 2.7 ± 0.5%, n = 3) was assessed in comparison with the isotype control (0.8 ± 0.01%) and represented as the mean ± SEM. (B) Mitochondria were also labelled with the B8H10 antibody. A representative histogram reveals that the B8H10+ (solid line) population has a higher amount of BH3+ mitochondria compared with the B8H10 (dashed line) population. (C) Quantification of BH3+ mitochondria from B8H10+ (black) and B8H10 (white) mitochondria (mean ± SEM, n = 3). **P < 0.01.
Figure 6
Figure 6
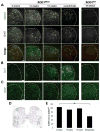
Accumulation of misfolded SOD1 in motor neurons begins prior to gliosis and motor neuron loss. Immunohistochemical analysis of SOD1G93A and SOD1WT rat spinal cords at different time points. Transverse sections of the lumbar spinal cord were stained and analyzed accordingly. (A) Sections were stained with anti-B8H10 (green) and co-labelled with choline acetyltransferase (red) demonstrating the presence of misfolded SOD1 in motor neurons beginning at 14 weeks. (B) Sections were stained with anti-Iba-I (marker of macrophages/microglia) or (C) anti-glial fibrillary acidic protein (astrocyte marker) to assess activation of microglia and astrocytes, respectively. (D) Representative image of spinal cord sections stained with Cresyl Violet. (E) Motor neurons in the anterior horn were counted and averaged per section (mean ± SEM, n = 3–5 per group). Scale bar = 100 μm. *P < 0.05.
Figure 7
Figure 7
Mitochondrial-associated misfolded SOD1 tracks with mitochondrial damage in the SOD1G37R mouse model. (A) The number of spinal cord (black circle), but not liver (white square), mitochondria that label positive for B8H10 increases with age. Each dot represents an individual mouse. Animals with greater than 1% of mitochondria labelling positive for B8H10 (within black box) were included in the functional analysis. (B) Quantification of the geometric mean of FSC of B8H10+ mitochondria (black) and B8H10 mitochondria (white) relative to the total population. (C) Quantification of ΔMFI of MTG of B8H10+ mitochondria and B8H10 mitochondria relative to the total population. (D) Quantification of the percentage of MitoSOX+ mitochondria in each mitochondrial subpopulation relative to the total population. *P < 0.05, **P < 0.01, ***P < 0.0001.
Figure 8
Figure 8
Misfolded SOD1 detection in ALS patient cells. Cell lysates were prepared from lymphoblastoid cell lines derived from healthy controls, non-ALS disease controls, sporadic ALS patients or familial ALS patients identified with SOD1 mutations and screened for B8H10-reactive SOD1. (A) Non-denaturing gel of lysates from healthy controls (controls 1–3) and ALS patients identified with SOD1 mutations (H48Q, D83G, G93V and I113T) were tested for reactivity with the B8H10 antibody targeted against misfolded SOD1. Recombinant SOD1G93A protein (100 ng) served as a positive control to verify the detection of misfolded SOD1. Bottom: denaturing gel blotted for total SOD1 and Actin served as loading controls. (B) Healthy controls (2) and non-ALS diseased controls (one individual with insomnia, two individuals with obsessive compulsive disorder and four individuals with sleeping disorders) were screened for B8H10-reactive misfolded SOD1. Bottom: denaturing gel blotted for total SOD1 and Actin served as loading controls. (C) Sporadic ALS patients (SALS 1–10) were screened for B8H10-reactive misfolded SOD1. Mutant SOD1 patients (H48Q and D83G) and three controls are included as positive and negative controls, respectively, for the B8H10 antibody. Bottom: denaturing gel blotted for total SOD1 and Actin served as a loading control. (D) Isolated mitochondria from one healthy control and two ALS patients carrying SOD1 mutations (D83G and H48Q) were probed for B8H10 reactivity on non-denaturing gels. Bottom: denaturing gel blotted for total SOD1, Hsp70 and Hsp60 which serve as controls for the cytoplasmic and mitochondrial fractions, respectively. Actin serves as a loading control.

Similar articles

Cited by

References

    1. Boillee S, Vande Velde C, Cleveland DW. ALS: a disease of motor neurons and their nonneuronal neighbors. Neuron. 2006;52:1–21. - PubMed
    1. Sasaki S, Iwata M. Impairment of fast axonal transport in the proximal axons of anterior horn neurons in amyotrophic lateral sclerosis. Neurology. 1996;47:535–540. - PubMed
    1. Dal Canto MC, Gurney ME. Development of central nervous system pathology in a murine transgenic model of human amyotrophic lateral sclerosis. Am J Pathol. 1994;145:1271–1279. - PMC - PubMed
    1. Higgins CM, Jung C, Ding H, Xu Z. Mutant Cu, Zn superoxide dismutase that causes motoneuron degeneration is present in mitochondria in the CNS. J Neurosci. 2002;22:RC215. - PMC - PubMed
    1. Kong J, Xu Z. Massive mitochondrial degeneration in motor neurons triggers the onset of amyotrophiclateral sclerosis in mice expressing a mutant SOD1. J Neurosci. 1998;18:3241–3250. - PMC - PubMed

Publication types

MeSH terms

Supplementary concepts