. 2013 May 27;201(5):709-24.
doi: 10.1083/jcb.201301131.

Aurora B spatially regulates EB3 phosphorylation to coordinate daughter cell adhesion with cytokinesis

Affiliations

Aurora B spatially regulates EB3 phosphorylation to coordinate daughter cell adhesion with cytokinesis

Jorge G Ferreira et al. J Cell Biol. .

Abstract

During mitosis, human cells round up, decreasing their adhesion to extracellular substrates. This must be quickly reestablished by poorly understood cytoskeleton remodeling mechanisms that prevent detachment from epithelia, while ensuring the successful completion of cytokinesis. Here we show that the microtubule end-binding (EB) proteins EB1 and EB3 play temporally distinct roles throughout cell division. Whereas EB1 was involved in spindle orientation before anaphase, EB3 was required for stabilization of focal adhesions and coordinated daughter cell spreading during mitotic exit. Additionally, EB3 promoted midbody microtubule stability and, consequently, midbody stabilization necessary for efficient cytokinesis. Importantly, daughter cell adhesion and cytokinesis completion were spatially regulated by distinct states of EB3 phosphorylation on serine 176 by Aurora B. This EB3 phosphorylation was enriched at the midbody and shown to control cortical microtubule growth. These findings uncover differential roles of EB proteins and explain the importance of an Aurora B phosphorylation gradient for the spatiotemporal regulation of microtubule function during mitotic exit and cytokinesis.


Figures
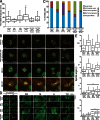
Figure 1.
Figure 1.
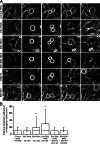
Depletion of EB proteins leads to different phenotypes during mitosis. HeLa cells expressing H2B-GFP/α-tubulin–mRFP were depleted of EB1 and/or EB3 and imaged by spinning disk microscopy. (A) Quantification of NEB-to-anaphase duration (*, P < 0.05 using nonparametric ANOVA followed by a post-hoc Dunn’s test). (B) Frames from time-lapse movies showing the phenotypes quantified. The arrow indicates a daughter cell that failed to attach to the substrate. Bars, 10 µm. (C) Cumulative quantification of mitotic phenotypes in all experimental groups. The spindle was considered “tilted” when the two poles were not on the same focal plane for >5 min. (D) HeLa cells were immunostained with an α-tubulin antibody, and top (xy) and lateral (yz) projections of the spindle were used to identify spindle poles and quantify spindle angle in relation to the substrate. Red circles highlight the spindle poles. Horizontal bar, 5 µm; vertical bar, 1.5 µm. (E) Quantification of spindle angles relative to the substrate in prometaphase (PM), metaphase (M), anaphase (A), and telophase/cytokinesis (T/C) for all treatment groups (*, P < 0.05 using parametric ANOVA followed by a post-hoc Student-Newman-Keuls test). Experiments were done in triplicate and N represents the number of cells quantified in each condition.
Figure 2.
Figure 2.
Characterization of postmitotic cell adhesion to the substrate. (A) HeLa cells were filmed using phase-contrast microscopy. 0 min corresponds to the first frame in anaphase. Arrows indicate cells with uncoordinated adhesion. Arrowheads and insets indicate cells expressing either the full-length EB3-GFP (EB3-FL) or the MT binding domain of EB3 (EB3-MT) that were tracked in this particular example. Bars, 10 µm. (B) Quantification of the adhesion delay between the first and the second daughter cells (*, P < 0.001 using nonparametric ANOVA followed by a post-hoc Dunn’s test). Experiments were done in triplicate and N represents the number of cells quantified in each condition.
Figure 3.
Figure 3.
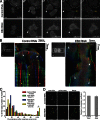
Stabilization of FAs upon mitotic exit. (A) HeLa cells expressing FAK-GFP were imaged by spinning disk microscopy during mitotic exit. (B) Chromo-kymographs of control and EB3-depleted cells expressing FAK-GFP during mitotic exit. To generate the chromo-kymographs, an ROI was selected that was aligned with the long axis of the cells in anaphase, and RGB components were attributed so that a smoothly varying color was assigned to objects at different y positions. This allows objects that colocalize in the x axis to be differentiated by color. White arrowheads highlight the nascent FAs formed after anaphase onset during cell spreading. Yellow arrowheads highlight the more stable FAs that appear later on as cells stabilized their shape. A.O., anaphase onset. Horizontal bar, 10 µm; vertical bar, 20 min. (C) Quantification of FA persistency after anaphase onset, as measured by the stability of FAK-positive structures. Depletion of EB3 leads to the disappearance of the more stable FAs, which can be rescued by expression of the EB3-MT (*, P < 0.001 using nonparametric ANOVA followed by a post-hoc Dunn’s test). N represents the number of FAs measured in three independent experiments. (D) Immunostaining showing the colocalization of FAK-GFP with the active form of FAK (pFAK-Y397). Note the extensive colocalization of both forms of the protein as determined by the Pearson’s correlation coefficient. Broken lines indicate the outline of the cells. White arrows show FAs in control cells appearing in the equator and the polar regions of both daughter cells. Bar, 10 µm. Yellow arrows show FAs in an EB3-depleted cell appearing in one of the daughter cells but not in the equator or the polar region of the other cell. Error bars indicate mean ± SEM.
Figure 4.
Figure 4.
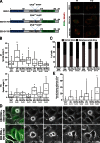
Cortical dephosphorylation of EB3 during mitotic exit is required for proper attachment to the substrate. (A) Diagram of full-length EB3 and the EB3-S176A and EB3-S176D mutants (left). Immunolocalization of α-tubulin and the EB3-FL, EB3-S176A, or EB3-S176D constructs in metaphase (M) and telophase (T/C) cells that were depleted of endogenous EB3 (right). Note the plus end localization of the mutants. (B) Quantification of spindle angles in metaphase (M) and telophase/cytokinesis (T/C) using fixed cells. (C) Quantification of mitotic phenotypes observed using spinning disk live-cell imaging. Note that neither EB3 mutant is able to rescue the EB1 phenotypes observed in metaphase cells. (D) Selected frames from time-lapse movies of HeLa cells depleted of endogenous EB3 and expressing EB3-S176A or EB3-S176D. Arrowheads highlight a cell that was tracked in each of the groups. Note the simultaneous spreading of both daughter cells in the EB3-S176A treatment, in contrast with the uncoordinated spreading observed in the EB3-S176D group. (E) Quantification of the delay in adhesion of the two daughter cells. The EB3-S176A mutant is able to induce coordinated attachment of both daughter cells to the substrate, whereas the EB3-S176D mutant fails to do so (*, P < 0.001 using nonparametric ANOVA [Kruskal-Wallis] followed by a post-hoc Dunn’s test). Experiments were done in triplicate and n represents the number of cells quantified for each condition. Bars: (A) 5 µm; (D) 20 µm.
Figure 5.
Figure 5.
EB3 is required for stabilization of the midbody upon mitotic exit. (A) HeLa cells were filmed in phase contrast to determine the number of failed cytokinesis events. Yellow arrowheads indicate the first time-frame where the midbody could be observed. The broken lines indicate the region that was used to generate the kymograph of the midbody position. Horizontal bar, 10 µm; vertical bar, 50 min. Note the formation of a binucleated cell in an EB3-depleted cell, where the midbody fails to stabilize. In the low-magnification images, white arrows indicate the cells that were tracked in this particular example. 0 min corresponds to the first frame in anaphase. (B) Quantification of the number of failed cytokinesis per total divisions observed upon EB3 and/or EB1 RNAi and respective rescue efficiencies with ectopic constructs. Error bars indicate mean ± SEM. *, P < 0.05 when compared to control RNAi using nonparametric ANOVA followed by a post-hoc Dunn’s test. (C) Quantification of midbody stability in control RNAi and EB3-depleted cells. Midbody movement amplitude and frequency were extracted from kymographs generated in the midbody region. Movement amplitude corresponds to the lateral deviation of the midbody throughout time. Movement frequency was defined as the number of midbody oscillations per unit of time. (*, P < 0.001 using nonparametric ANOVA followed by a post-hoc Dunn’s test). All experiments were done in triplicate, and n represents the number of cells quantified in each condition. (D) FRAP analysis of the midbody region in cells expressing α-tubulin–GFP. The percentages of fluorescence recovery and half-time recovery were determined by applying a double (control and EB1 RNAi) or single (EB3 RNAi) exponential fitting to the recovery curve. Time is given in minutes:seconds. Horizontal bar, 10 µm; vertical bars, 3 µm. *, P < 0.05 when compared to control RNAi using nonparametric ANOVA followed by a post-hoc Dunn’s test.
Figure 6.
Figure 6.
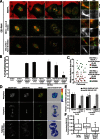
Phosphorylation of EB3 by spatially regulated Aurora B. (A) Frames from time-lapse movies of cells expressing α-tubulin–mRFP and either EB3-FL or EB3-S176D tagged with GFP in the presence or absence of the Aurora B inhibitor ZM447439 upon EB3 RNAi. Higher magnification images highlight the midbodies before and after dissolution. Time is given in hours:minutes. Bars: (main panels) 10 µm; (insets) 3 µm. (B) Quantification of the percentage of cells that fail cytokinesis after inhibition of Aurora A (MLN8054) or Aurora B (ZM447439), and the respective dependence on EB3 phosphorylation. Error bars indicate mean ± SEM. (C) Correlation between the midbody dissolution time and cytokinesis outcome in cells expressing either EB3-FL or EB3-S176D and treated with the Aurora B inhibitor upon EB3 RNAi. Note the positive correlation between the midbody dissolution time and cytokinesis success. (D) Immunolocalization of endogenous pEB3-S176. Cells expressing the EB3-MT-GFP construct were used to facilitate detection of MT plus ends. The ratio between pEB3-S176 and EB3-MT-GFP is shown on the right. Bars, 10 µm. (E) Quantification of the subcellular colocalization of endogenous pEB3-S176. Note that phosphorylation of EB3 at S176 occurs throughout the spindle in early mitosis but is concentrated in the midbody in telophase. Error bars indicate mean ± SEM. (F) Inhibition of Aurora B leads to a significant decrease in the levels of pEB3-S176 in the midbody when normalized relative to EB3-MT-GFP and tubulin. (*, P < 0.001 using nonparametric ANOVA followed by a post-hoc Dunn’s test). Experiments were done in triplicate and n represents the number of cells quantified in each condition.
Figure 7.
Figure 7.
Proposed model for the phosphoregulation of EB3 function during mitotic exit and cytokinesis. In late mitosis, an Aurora B phosphorylation gradient ensures that only MTs in the furrow region remain phosphorylated, whereas MTs in the vicinity of the substrate contain dephosphorylated EB3. Phosphorylation of EB3 at S176 by Aurora B ensures successful cytokinesis completion by promoting midbody MT stability and midbody stabilization. Dephosphorylation of EB3 occurs near the substrate and restricts MT growth, allowing for coordinated daughter cell spreading, which, by itself, indirectly potentiates the successful completion of cytokinesis.

Similar articles

Cited by

References

    1. Akhmanova A., Steinmetz M.O. 2008. Tracking the ends: a dynamic protein network controls the fate of microtubule tips. Nat. Rev. Mol. Cell Biol. 9:309–322 10.1038/nrm2369 - DOI - PubMed
    1. Ban R., Matsuzaki H., Akashi T., Sakashita G., Taniguchi H., Park S.Y., Tanaka H., Furukawa K., Urano T. 2009. Mitotic regulation of the stability of microtubule plus-end tracking protein EB3 by ubiquitin ligase SIAH-1 and Aurora mitotic kinases. J. Biol. Chem. 284:28367–28381 10.1074/jbc.M109.000273 - DOI - PMC - PubMed
    1. Brüning-Richardson A., Langford K.J., Ruane P., Lee T., Askham J.M., Morrison E.E. 2011. EB1 is required for spindle symmetry in mammalian mitosis. PLoS ONE. 6:e28884 10.1371/journal.pone.0028884 - DOI - PMC - PubMed
    1. Bu W., Su L.K. 2001. Regulation of microtubule assembly by human EB1 family proteins. Oncogene. 20:3185–3192 10.1038/sj.onc.1204429 - DOI - PubMed
    1. De Groot C.O., Jelesarov I., Damberger F.F., Bjelić S., Schärer M.A., Bhavesh N.S., Grigoriev I., Buey R.M., Wüthrich K., Capitani G., et al. 2010. Molecular insights into mammalian end-binding protein heterodimerization. J. Biol. Chem. 285:5802–5814 10.1074/jbc.M109.068130 - DOI - PMC - PubMed

Publication types