. 2013 Sep 1;440(1):81-95.
doi: 10.1016/j.ab.2013.05.011. Epub 2013 May 24.

Improving the thermal, radial, and temporal accuracy of the analytical ultracentrifuge through external references

Affiliations

Improving the thermal, radial, and temporal accuracy of the analytical ultracentrifuge through external references

Rodolfo Ghirlando et al. Anal Biochem. .

Abstract

Sedimentation velocity (SV) is a method based on first principles that provides a precise hydrodynamic characterization of macromolecules in solution. Due to recent improvements in data analysis, the accuracy of experimental SV data emerges as a limiting factor in its interpretation. Our goal was to unravel the sources of experimental error and develop improved calibration procedures. We implemented the use of a Thermochron iButton temperature logger to directly measure the temperature of a spinning rotor and detected deviations that can translate into an error of as much as 10% in the sedimentation coefficient. We further designed a precision mask with equidistant markers to correct for instrumental errors in the radial calibration that were observed to span a range of 8.6%. The need for an independent time calibration emerged with use of the current data acquisition software (Zhao et al., Anal. Biochem., 437 (2013) 104-108), and we now show that smaller but significant time errors of up to 2% also occur with earlier versions. After application of these calibration corrections, the sedimentation coefficients obtained from 11 instruments displayed a significantly reduced standard deviation of approximately 0.7%. This study demonstrates the need for external calibration procedures and regular control experiments with a sedimentation coefficient standard.

Keywords: Hydrodynamic modeling; Sedimentation equilibrium; Sedimentation velocity.


Figures

Figure 1
Figure 1
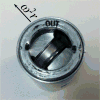
(A) An image of the Thermochron iButton® temperature logger placed in the specially designed aluminum holder and AUC cell housing. The cell is placed such that the 135° orientation faces away from the center of rotation. (B) An image of the radial mask placed within the AUC cell housing by sandwiching between two AUC windows. (C) The radial mask showing the reference sector on the left and sample sector on the right. The notch for alignment with the cell housing is shown on the top. The ruler shows distances in cm.
Figure 1
Figure 1
(A) An image of the Thermochron iButton® temperature logger placed in the specially designed aluminum holder and AUC cell housing. The cell is placed such that the 135° orientation faces away from the center of rotation. (B) An image of the radial mask placed within the AUC cell housing by sandwiching between two AUC windows. (C) The radial mask showing the reference sector on the left and sample sector on the right. The notch for alignment with the cell housing is shown on the top. The ruler shows distances in cm.
Figure 2
Figure 2
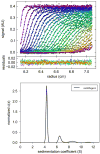
(A) Representative absorbance scans of the sedimentation velocity data of BSA (symbols, showing only every 3rd data point of every 3rd scan), and best-fit boundary model from the c(s) analysis in SEDFIT (solid lines). (B) Residuals of the fit, with a root-mean-square deviation of 0.0054 OD. (C) Best-fit sedimentation coefficient distribution c(s). Figure created with GUSSI, reproduced from [40].
Figure 3
Figure 3
(A) Experimental sedimentation coefficients for monomeric BSA obtained from eight analytical ultracentrifuges in study I, plotted as a function of the best-fit meniscus position. Experiments were conducted in duplicate and data obtained from Cell 1 for the different centrifuges are shown in unique colors. Absorbance (round symbols) and, when possible, interference (square symbols) data were collected. As Version 6.0 (Firmware 5.06) of the ProteomeLab XL/I acquisition software was used in all ultracentrifuges, sedimentation coefficients are ∼ 10% larger than the true value. Using the average best-fit s-value of the BSA monomer and meniscus position, a set of sedimentation velocity data were simulated in SEDFIT. The solid green line shows how a fixed meniscus position influences the best-fit s-value in a c(s) analysis. Simulated SV data were radially translated to simulate translation errors δr in the radius. The solid purple line shows how such errors influence the sedimentation coefficient. Dotted green and purple lines show s-values if the temperature were changed by ± 0.5 °C. (B) Simulated data were analyzed in SEDPHAT in terms of a single non-interacting ideal solute. The error surface depicting the global reduced χ2 as a function of the s-value and fitted meniscus position shows a well defined minimum.
Figure 4
Figure 4
Experimental sedimentation coefficients for monomeric BSA obtained from eight analytical ultracentrifuges in study I plotted as a function of the best-fit meniscus position. Panels show data obtained from (A) Cell 1, (B) Cell 2 and (C) Cell 3 of identical runs illustrating consistencies in data collected from the same ultracentrifuge. The same instrument color coding is used for each cell and the complete data set is listed in Supplementary Table 1.
Figure 5
Figure 5
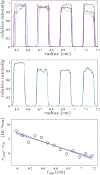
Calibration of the radial magnification through imaging of the mask. (Top) Overlay of the absorbance intensity scans of the mask obtained from five different centrifuges at 50,000 rpm. The same cell assembly with mask was run in all instruments, without disassembly. For clarity, only a subset of the image is displayed that shows only 4 of the 7 calibration holes. (Middle) Analogous overlay of mask images from repeat experiments from the same instrument. (Bottom) To determine the edges of the calibration holes, 10 replicate scans of the mask are analyzed and the apparent radial position of the average steepest ascent, ri,app , are determined. The spacing between the ri,app is compared to the expected spacing of 1.0011 mm, and plotted as the difference of all ri,app positions to the best-fit edge positions constraining their distance to be 1.0011 mm, ri,0 (circles). The solid line indicates the best linear fit through ri,appri,0 , in this case corresponding to an imaged edge spacing of 0.09938 cm. The light colored area indicates the 68% confidence region corresponding to edge distances from 0.09925 cm to 0.09950 cm.
Figure 6
Figure 6
Effect of external temperature and radial calibration on the measured sedimentation coefficients of the BSA monomer, all acquired at a nominal run temperature of 20 °C with the absorbance optical system. Shown are the measured time-corrected sexp,τ-values prior to radial magnification correction (green asterisks), and the corresponding srad,τ-values after radial magnification correction (blue solid circles), respectively, plotted against the actual rotor temperature measured with the Thermochron iButton®. The lines represent the theoretical temperature-dependence, accounting for water viscosity, based on the average s20, rad, τ–value of 4.333 S for all absorbance data shown including radial corrections (blue), and based on the average s20, τ–value of 4.294 S for all absorbance data excluding radial corrections (green). The horizontal grey line indicates the average sτ–value of 4.195 S for all absorbance data with neither temperature nor radial magnification corrections, as would be presumed based on the manufacturer's temperature and radial calibration at the used settings of 20 °C for all experiments.
Figure 7
Figure 7
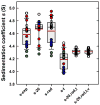
Box-and-whisker plot (SigmaPlot) of the s-values before and after external calibration corrections. For each set, the size of the grey box represents the lower and upper quartiles (25th-75th percentile) of the data set (Table 1). The bold red line represents the mean and the thinner black line the median. Whiskers, calculated using the standard method, represent the 10th and 90th percentiles in the data. Outliers represent the remaining 20 percent of the data are shown individually. All data are shown as circles and bars are labeled as in Table 1: sexp for the experimental s-values prior to any corrections, s20 for the values corrected solely for temperature, srad for the values corrected solely for radial magnification errors, st for values subjected to scan time corrections, s20,rad,t for values corrected simultaneously for temperature, radial magnification, and scan times, and finally s20,rad,t,v further corrected for the absorbance finite scanning times . Data for Larry and Shemp, which show temperature extremes, are highlighted in red and blue, respectively. The latter instrument also shows the largest radial magnification errors. Data for Clotho with the smallest scan-time errors are shown in green.

Similar articles

  • A multilaboratory comparison of calibration accuracy and the performance of external references in analytical ultracentrifugation.
    Zhao H, Ghirlando R, Alfonso C, Arisaka F, Attali I, Bain DL, Bakhtina MM, Becker DF, Bedwell GJ, Bekdemir A, Besong TM, Birck C, Brautigam CA, Brennerman W, Byron O, Bzowska A, Chaires JB, Chaton CT, Cölfen H, Connaghan KD, Crowley KA, Curth U, Daviter T, Dean WL, Díez AI, Ebel C, Eckert DM, Eisele LE, Eisenstein E, England P, Escalante C, Fagan JA, Fairman R, Finn RM, Fischle W, de la Torre JG, Gor J, Gustafsson H, Hall D, Harding SE, Cifre JG, Herr AB, Howell EE, Isaac RS, Jao SC, Jose D, Kim SJ, Kokona B, Kornblatt JA, Kosek D, Krayukhina E, Krzizike D, Kusznir EA, Kwon H, Larson A, Laue TM, Le Roy A, Leech AP, Lilie H, Luger K, Luque-Ortega JR, Ma J, May CA, Maynard EL, Modrak-Wojcik A, Mok YF, Mücke N, Nagel-Steger L, Narlikar GJ, Noda M, Nourse A, Obsil T, Park CK, Park JK, Pawelek PD, Perdue EE, Perkins SJ, Perugini MA, Peterson CL, Peverelli MG, Piszczek G, Prag G, Prevelige PE, Raynal BD, Rezabkova L, Richter K, Ringel AE, Rosenberg R, Rowe AJ, Rufer AC, Scott DJ, Seravalli JG, Solovyova AS, Song R, Staunton D, Stoddard C, Stott K, Strauss HM, Streicher WW, Sumida JP, Swygert SG, Szczepanowski RH, Tessmer I, Toth RT 4th, Tripathy A, Uchiyama S, Uebel SF, Unzai S, Gruber … See abstract for full author list ➔ Zhao H, et al. PLoS One. 2015 May 21;10(5):e0126420. doi: 10.1371/journal.pone.0126420. eCollection 2015. PLoS One. 2015. PMID: 25997164 Free PMC article.
  • Improved measurement of the rotor temperature in analytical ultracentrifugation.
    Zhao H, Balbo A, Metger H, Clary R, Ghirlando R, Schuck P. Zhao H, et al. Anal Biochem. 2014 Apr 15;451:69-75. doi: 10.1016/j.ab.2014.02.006. Epub 2014 Feb 14. Anal Biochem. 2014. PMID: 24530285 Free PMC article.
  • A radial calibration window for analytical ultracentrifugation.
    LeBrun T, Schuck P, Wei R, Yoon JS, Dong X, Morgan NY, Fagan J, Zhao H. LeBrun T, et al. PLoS One. 2018 Jul 30;13(7):e0201529. doi: 10.1371/journal.pone.0201529. eCollection 2018. PLoS One. 2018. PMID: 30059530 Free PMC article.
  • Analytical ultracentrifugation for the study of protein association and assembly.
    Howlett GJ, Minton AP, Rivas G. Howlett GJ, et al. Curr Opin Chem Biol. 2006 Oct;10(5):430-6. doi: 10.1016/j.cbpa.2006.08.017. Epub 2006 Aug 28. Curr Opin Chem Biol. 2006. PMID: 16935549 Review.
  • Modern analytical ultracentrifugation in protein science: a tutorial review.
    Lebowitz J, Lewis MS, Schuck P. Lebowitz J, et al. Protein Sci. 2002 Sep;11(9):2067-79. doi: 10.1110/ps.0207702. Protein Sci. 2002. PMID: 12192063 Free PMC article. Review.

Cited by

References

    1. Howlett GJ, Minton AP, Rivas G. Analytical ultracentrifugation for the study of protein association and assembly. Curr Opin Chem Biol. 2006;10:430–436. - PubMed
    1. Schuck P, Zhao H. Editorial for the special issue of methods “Modern Analytical Ultracentrifugation”. Methods. 2011;54:1–3. - PubMed
    1. Arisaka F. Applications and future perspectives of analytical ultracentrifugation. Tanpakushitsu Kakusan Koso. 1999;44:82–91. - PubMed
    1. Harding SE, Rowe AJ. Insight into protein-protein interactions from analytical ultracentrifugation. Biochem Soc Transact. 2010;38:901–7. - PubMed
    1. Trautman R. The impact of the desk-top computer on ultracentrifugation. Ann N Y Acad Sci. 1969;164:52–65.

Publication types

Substances

LinkOut - more resources