. 2013 May 22;33(21):8961-73.
doi: 10.1523/JNEUROSCI.0989-13.2013.

The class 4 semaphorin Sema4D promotes the rapid assembly of GABAergic synapses in rodent hippocampus

Affiliations

The class 4 semaphorin Sema4D promotes the rapid assembly of GABAergic synapses in rodent hippocampus

Marissa S Kuzirian et al. J Neurosci. .

Abstract

Proper circuit function in the mammalian nervous system depends on the precise assembly and development of excitatory and inhibitory synaptic connections between neurons. Through a loss-of-function genetic screen in cultured hippocampal neurons, we previously identified the class 4 Semaphorin Sema4D as being required for proper GABAergic synapse development. Here we demonstrate that Sema4D is sufficient to promote GABAergic synapse formation in rodent hippocampus and investigate the kinetics of this activity. We find that Sema4D treatment of rat hippocampal neurons increases the density of GABAergic synapses as detected by immunocytochemistry within 30 min, much more rapidly than has been previously described for a prosynaptogenic molecule, and show that this effect is dependent on the Sema4D receptor PlexinB1 using PlxnB1(-/-) mice. Live imaging studies reveal that Sema4D elicits a rapid enhancement (within 10 min) in the rate of addition of synaptic proteins. Therefore, we demonstrate that Sema4D, via PlexinB1, acts to initiate synapse formation by recruiting molecules to both the presynaptic and the postsynaptic terminals; these nascent synapses subsequently become fully functional by 2 h after Sema4D treatment. In addition, acute treatment of an organotypic hippocampal slice epilepsy model with Sema4D reveals that Sema4D rapidly and dramatically alters epileptiform activity, which is consistent with a Sema4D-mediated shift in the balance of excitation and inhibition within the circuit. These data demonstrate an ability to quickly assemble GABAergic synapses in response to an appropriate signal and suggest a potential area of exploration for the development of novel antiepileptic drugs.


Figures
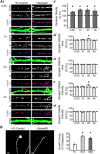
Figure 1.
Figure 1.
Soluble Sema4D-Fc treatment rapidly increases the density of inhibitory synapses. Ai, Representative stretches of dendrite from neurons treated with either Fc control or Sema4D-Fc and immunostained for GAD65 (red), GABAARγ2 (blue), and MAP2 (green) to visualize dendrites at 0.5, 1, 2, and 4 h of treatment. Scale bars, 2 μm. Aii, Quantification of inhibitory synapse density (GAD65/γ2) as percentage synapse density of Fc control treated neurons (100%, represented by dashed line). Aiii, Aiv, Quantification of the average area of GAD65 (Aiii) and GABAARγ2 (Aiv) puncta as the percentage of Fc control treated neurons (100%, represented by dashed line). Av, Avi, Quantification of the average fluorescence intensity of GAD65 (Av) and GABAARγ2 (Avi) puncta as the percentage of Fc control treated neurons (100%, represented by dashed line; n > 50 neurons in each condition, 3+ experiments; *p < 0.05, two-way ANOVA). B, Left: Representative images of growth cones from cultured hippocampal neurons treated with Fc control (10 nm, left) or Sema4D-Fc (10 nm, right). Right: Quantification of the percentage collapsed growth cones (n > 84 growth cones per treatment; scale bar, 5 μm; *p < 0.05 Student's t test). All data are plotted as mean ± SEM.
Figure 2.
Figure 2.
Sema4D-Fc treatment increases the density of inhibitory but not excitatory synapses. A, Top: Representative stretches of dendrite from neurons treated with either Fc control or Sema4D-Fc for 0.5 or 1 h and immunostained for Synapsin I (red), Gephyrin (blue), and MAP2 (green). Scale bars, 5 μm. Bottom: Quantification of inhibitory (Gephyrin/Synapsin) synapse density of neurons treated with Sema4D-Fc for 0.5, 1, 2, and 4 h plotted as percentage of Fc control treated neurons (100% represented by dashed line; n > 40 neurons in each condition, 2+ experiments). B, Top: Representative stretches of dendrite from neurons treated with either Fc control or Sema4D-Fc for 0.5 or 1 h and immunostained for Synapsin I (red), GluA2 (blue), and MAP2 (green). Bottom: Quantification of excitatory synapse density (measured by GluA2/Synapsin I staining) of neurons treated 0.5, 1, 2 and 4 h plotted as a percentage of Fc control treated neurons (100% represented by dashed line; n > 45 neurons in each condition from at least 3 experiments for 0.5, 1 and 2 h; n>20 neurons from 1 experiment for 4 h). Scale bars, 5 μm.*p < 0.05, two-way ANOVA.
Figure 3.
Figure 3.
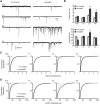
Sema4D-Fc drives formation of functional GABAergic synapses. A, Representative whole-cell voltage-clamp recordings of mIPSCs from primary hippocampal neurons treated with Fc control (left) or Sema4D-Fc (right) for 0.5, 1, 2, and 4 h. B, Quantification of mIPSC (top) frequency and (bottom) amplitude, *p < 0.05, Student's t test compared with corresponding Fc control. Data plotted as mean ± SEM. C, D, Cumulative distribution plots of mIPSC interevent intervals (C) and mIPSC amplitude (D) at 0.5, 1, 2, and 4 h of Sema4D-Fc treatment. n = 14 neurons for all conditions from three experiments. *p < 0.02, Kolmogorov–Smirnov test.
Figure 4.
Figure 4.
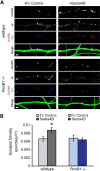
Sema4D-Fc triggers an increase in GABAergic synapse density in a PlexinB1-dependent manner. A, Representative stretches of dendrites from neurons (wildtype, top; PlxnB1−/−, bottom) treated with Fc control (left) or Sema4D-Fc (right) immunostained for the presynaptic protein GAD65 (red), the postsynaptic protein GABAARγ2 (blue), and MAP2 (green) to visualize dendrites. Scale bars, 2 μm. B, Quantification of inhibitory synapse density. n > 58 neurons for each condition from three experiments; *p < 0.05, two-way ANOVA. Data are plotted as mean ± SEM.
Figure 5.
Figure 5.
The formation of functional GABAergic synapses in response to Sema4D-Fc treatment is PlexinB1 dependent. A, Representative mIPSCs recorded from wildtype (top) or PlxnB1−/− (bottom) CA1 neurons in acute hippocampal slice treated with either Fc control or Sema4D-Fc for 2 h. B, C, Quantification of mIPSC frequency (B) and mIPSC amplitude (C); n = 29 neurons per condition; *p < 0.05 compared with wildtype Fc control treatment, Student's t test. For AC, All data are plotted as mean ± SEM. D, E, Cumulative distribution plots of mIPSC interevent intervals (D) and amplitude (E) in wildtype (gray lines) and PlxnB1−/− mice (blue lines) in the absence (Fc Control) or presence of Sema4D-Fc. n = 29 neurons each condition from four experiments; *p < 0.02, Kolmogorov–Smirnov test.
Figure 6.
Figure 6.
Sema4D-AP treatment promotes GABAergic synapse formation onto both dendrites and somas of hippocampal neurons. A, Stretches of dendrites from cultured hippocampal neurons isolated from PlxnB1−/− or wildtype littermates (11 DIV) treated with AP control (AP alone) or Sema4D-AP for 4 h. Neurons were immunostained for GAD65 (red), GABAARγ2 (blue), and MAP2 (green). Scale bar, 5 μm B, Inhibitory synapses (GAD65/GABAAR γ2) on the somas of neurons treated with AP control or Sema4D-AP were analyzed by tracing somas (white dashed lines) and synapse density was quantified within these regions of interest. Scale bar, 5 μm. C, Quantification of synapse density from A and B plotted as a percentage of AP control (100% represented by dashed line; data are plotted as mean ± SEM; n > 20, 2 experiments; *p < 0.05, two-way ANOVA).
Figure 7.
Figure 7.
Application of soluble Sema4D-Fc leads to a rapid increase in the rate of GFP-Gephyrin addition in cultured hippocampal neurons. A, Stretches of dendrite from cultured rat hippocampal neurons expressing GFP-Gephyrin and treated with Fc control (left) or Sema4D-Fc (right). Scale bars, 2 μm. Below each dendrite is a kymograph of the region highlighted by the red box above that visualizes the movement of puncta over time. B indicates before treatment; 10, 0–10 min after treatment; 20, 10–20 min after treatment; 30, 20–30 min after treatment; blue arrows, puncta splitting event. B, Additional representative kymographs from sample stretches of different dendrites from the same neurons as in A. Scale bars: y-axis = 3 min, x-axis = 3 μm. C, Top: The number of puncta added (average per neuron) during each imaging session in either Fc control (light gray) or Sema4D-treated neurons (dark gray). *p < 0.05, Student's t test. Bottom: The average number of GFP-Gephyrin puncta added normalized to the total number of GFP-Gephyrin puncta per neuron. *p < 0.05, Student's t test. D, Top: The number of GFP-Gephyrin puncta removed (average per neuron) during the imaging session in either Fc control (light gray) or Sema4D-treated neurons (dark gray). Bottom: The average number of GFP-Gephyrin puncta removed normalized to the total number of GFP-Gephyrin puncta per neuron. The average number of GFP-Gephyrin puncta was not different between conditions. Sema4D-Fc: n = 5 neurons, 1025 puncta, average 205 puncta/neuron (±22.75); Fc control: n = 3 neurons, 446 puncta, average 148.67 puncta/neuron (±33.9). All data are plotted as mean ± SEM.
Figure 8.
Figure 8.
Sema4D-Fc treatment rapidly suppresses TTX-induced epileptic activity. A, Representative traces of spontaneous activity observed in untreated (left) or TTX-treated slices (TTX-EA, right) with either Fc control (top) or Sema4D-Fc treatment (bottom). Note that for these representative traces, spikes are only present in the TTX-EA Fc control condition. B, Quantification of average spike frequency (top) and total area (bottom) measured from baseline (dashed red line) for each condition; n > 12 neurons for each condition; *p < 0.05, Student's t test. C, D, Representative traces of sIPSCs (C) or sEPSCs (D) observed in untreated (left) or TTX-EA slices (1 μm, right) with either Fc control (1 nm, top) or Sema4D-Fc treatment (1 nm, bottom). Shown is the quantification of total inhibitory synaptic charge (C) or total excitatory synaptic charge (D) measured from the same cell for each experimental condition. For C and D, n = 19 neurons for each condition; *p < 0.05, Student's t test. All data are plotted as mean ± SEM.

Similar articles

Cited by

References

    1. Bausch SB, He S, Petrova Y, Wang XM, McNamara JO. Plasticity of both excitatory and inhibitory synapses is associated with seizures induced by removal of chronic blockade of activity in cultured hippocampus. J Neurophysiol. 2006;96:2151–2167. doi: 10.1152/jn.00355.2006. - DOI - PubMed
    1. Bernard C, Cossart R, Hirsch JC, Esclapez M, Ben-Ari Y. What is GABAergic inhibition? How is it modified in epilepsy? Epilepsia. 2000;41:S90–S95. doi: 10.1111/j.1528-1157.2000.tb01564.x. - DOI - PubMed
    1. Cesca F, Baldelli P, Valtorta F, Benfenati F. The synapsins: key actors of synapse function and plasticity. Prog Neurobiol. 2010;91:313–348. doi: 10.1016/j.pneurobio.2010.04.006. - DOI - PubMed
    1. Chen AI, Nguyen CN, Copenhagen DR, Badurek S, Minichiello L, Ranscht B, Reichardt LF. TrkB (tropomyosin-related kinase B) controls the assembly and maintenance of GABAergic synapses in the cerebellar cortex. J Neurosci. 2011;31:2769–2780. doi: 10.1523/JNEUROSCI.4991-10.2011. - DOI - PMC - PubMed
    1. Chen Y, Stevens B, Chang J, Milbrandt J, Barres BA, Hell JW. NS21: re-defined and modified supplement B27 for neuronal cultures. J Neurosci Methods. 2008;171:239–247. doi: 10.1016/j.jneumeth.2008.03.013. - DOI - PMC - PubMed

Publication types

MeSH terms