IL-21 restricts virus-driven Treg cell expansion in chronic LCMV infection
- PMID: 23696736
- PMCID: PMC3656089
- DOI: 10.1371/journal.ppat.1003362
IL-21 restricts virus-driven Treg cell expansion in chronic LCMV infection
Abstract
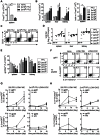
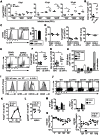
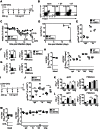
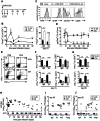
Foxp3+ regulatory T (Treg) cells are essential for the maintenance of immune homeostasis and tolerance. During viral infections, Treg cells can limit the immunopathology resulting from excessive inflammation, yet potentially inhibit effective antiviral T cell responses and promote virus persistence. We report here that the fast-replicating LCMV strain Docile triggers a massive expansion of the Treg population that directly correlates with the size of the virus inoculum and its tendency to establish a chronic, persistent infection. This Treg cell proliferation was greatly enhanced in IL-21R-/- mice and depletion of Treg cells partially rescued defective CD8+ T cell cytokine responses and improved viral clearance in some but not all organs. Notably, IL-21 inhibited Treg cell expansion in a cell intrinsic manner. Moreover, experimental augmentation of Treg cells driven by injection of IL-2/anti-IL-2 immune complexes drastically impaired the functionality of the antiviral T cell response and impeded virus clearance. As a consequence, mice became highly susceptible to chronic infection following exposure to low virus doses. These findings reveal virus-driven Treg cell proliferation as potential evasion strategy that facilitates T cell exhaustion and virus persistence. Furthermore, they suggest that besides its primary function as a direct survival signal for antiviral CD8+ T cells during chronic infections, IL-21 may also indirectly promote CD8+ T cell poly-functionality by restricting the suppressive activity of infection-induced Treg cells.
Conflict of interest statement
I have read the journal's policy and have the following conflicts: WJL is an inventor on patents related to IL-21. The other authors have no conflicting financial interests. This does not alter our adherence to all PLoS Pathogens policies on sharing data and materials.
Figures


Similar articles
-
IL-2 consumption by highly activated CD8 T cells induces regulatory T-cell dysfunction in patients with hemophagocytic lymphohistiocytosis.J Allergy Clin Immunol. 2016 Jul;138(1):200-209.e8. doi: 10.1016/j.jaci.2015.12.1314. Epub 2016 Mar 4. J Allergy Clin Immunol. 2016. PMID: 26947179
-
IRF9 Prevents CD8+ T Cell Exhaustion in an Extrinsic Manner during Acute Lymphocytic Choriomeningitis Virus Infection.J Virol. 2017 Oct 27;91(22):e01219-17. doi: 10.1128/JVI.01219-17. Print 2017 Nov 15. J Virol. 2017. PMID: 28878077 Free PMC article.
-
PC61 (anti-CD25) treatment inhibits influenza A virus-expanded regulatory T cells and severe lung pathology during a subsequent heterologous lymphocytic choriomeningitis virus infection.J Virol. 2013 Dec;87(23):12636-47. doi: 10.1128/JVI.00936-13. Epub 2013 Sep 18. J Virol. 2013. PMID: 24049180 Free PMC article.
-
T cell responses to viral infections: lessons from lymphocytic choriomeningitis virus.Immunol Res. 2002;26(1-3):309-21. doi: 10.1385/IR:26:1-3:309. Immunol Res. 2002. PMID: 12403369 Review.
-
Complexities of Type I Interferon Biology: Lessons from LCMV.Viruses. 2019 Feb 20;11(2):172. doi: 10.3390/v11020172. Viruses. 2019. PMID: 30791575 Free PMC article. Review.
Cited by
-
Limitations of Foxp3(+) Treg depletion following viral infection in DEREG mice.J Immunol Methods. 2014 Apr;406:58-65. doi: 10.1016/j.jim.2014.03.005. Epub 2014 Mar 15. J Immunol Methods. 2014. PMID: 24642426 Free PMC article.
-
Homeostasis and function of regulatory T cells (Tregs) in vivo: lessons from TCR-transgenic Tregs.Immunol Rev. 2014 May;259(1):23-39. doi: 10.1111/imr.12165. Immunol Rev. 2014. PMID: 24712457 Free PMC article. Review.
-
Genetic disruption of CD8+ Treg activity enhances the immune response to viral infection.Proc Natl Acad Sci U S A. 2013 Dec 24;110(52):21089-94. doi: 10.1073/pnas.1320999110. Epub 2013 Dec 9. Proc Natl Acad Sci U S A. 2013. PMID: 24324159 Free PMC article.
-
Regulatory T Cell Development in the Thymus.J Immunol. 2019 Oct 15;203(8):2031-2041. doi: 10.4049/jimmunol.1900662. J Immunol. 2019. PMID: 31591259 Free PMC article. Review.
-
T-Cell Exhaustion in Chronic Infections: Reversing the State of Exhaustion and Reinvigorating Optimal Protective Immune Responses.Front Immunol. 2018 Nov 9;9:2569. doi: 10.3389/fimmu.2018.02569. eCollection 2018. Front Immunol. 2018. PMID: 30473697 Free PMC article. Review.
References
-
- Sakaguchi S, Sakaguchi N, Asano M, Itoh M, Toda M (1995) Immunologic self-tolerance maintained by activated T cells expressing IL-2 receptor alpha-chains (CD25). Breakdown of a single mechanism of self-tolerance causes various autoimmune diseases. J Immunol 155: 1151–1164. - PubMed
-
- Fontenot JD, Gavin MA, Rudensky AY (2003) Foxp3 programs the development and function of CD4+CD25+ regulatory T cells. Nat Immunol 4: 330–336. - PubMed
-
- Hori S, Takahashi T, Sakaguchi S (2003) Control of autoimmunity by naturally arising regulatory CD4+ T cells. Adv Immunol 81: 331–371. - PubMed
-
- Khattri R, Cox T, Yasayko SA, Ramsdell F (2003) An essential role for Scurfin in CD4+CD25+ T regulatory cells. Nat Immunol 4: 337–342. - PubMed
-
- Sakaguchi S, Sakaguchi N, Asano M, Itoh M, Toda M (1995) Immunologic self-tolerance maintained by activated T cells expressing IL-2 receptor alpha-chains (CD25). Breakdown of a single mechanism of self-tolerance causes various autoimmune diseases. J Immunol 155: 1151–1164. - PubMed
Publication types
MeSH terms
Substances
Grants and funding
LinkOut - more resources
Full Text Sources
Other Literature Sources
Molecular Biology Databases
Research Materials

