. 2013;9(5):e1003336.
doi: 10.1371/journal.ppat.1003336. Epub 2013 May 16.

Abortive lytic reactivation of KSHV in CBF1/CSL deficient human B cell lines

Affiliations

Abortive lytic reactivation of KSHV in CBF1/CSL deficient human B cell lines

Barbara A Scholz et al. PLoS Pathog. 2013.

Abstract

Since Kaposi's sarcoma associated herpesvirus (KSHV) establishes a persistent infection in human B cells, B cells are a critical compartment for viral pathogenesis. RTA, the replication and transcription activator of KSHV, can either directly bind to DNA or use cellular DNA binding factors including CBF1/CSL as DNA adaptors. In addition, the viral factors LANA1 and vIRF4 are known to bind to CBF1/CSL and modulate RTA activity. To analyze the contribution of CBF1/CSL to reactivation in human B cells, we have successfully infected DG75 and DG75 CBF1/CSL knock-out cell lines with recombinant KSHV.219 and selected for viral maintenance by selective medium. Both lines maintained the virus irrespective of their CBF1/CSL status. Viral reactivation could be initiated in both B cell lines but viral genome replication was attenuated in CBF1/CSL deficient lines, which also failed to produce detectable levels of infectious virus. Induction of immediate early, early and late viral genes was impaired in CBF1/CSL deficient cells at multiple stages of the reactivation process but could be restored to wild-type levels by reintroduction of CBF1/CSL. To identify additional viral RTA target genes, which are directly controlled by CBF1/CSL, we analyzed promoters of a selected subset of viral genes. We show that the induction of the late viral genes ORF29a and ORF65 by RTA is strongly enhanced by CBF1/CSL. Orthologs of ORF29a in other herpesviruses are part of the terminase complex required for viral packaging. ORF65 encodes the small capsid protein essential for capsid shell assembly. Our study demonstrates for the first time that in human B cells viral replication can be initiated in the absence of CBF1/CSL but the reactivation process is severely attenuated at all stages and does not lead to virion production. Thus, CBF1/CSL acts as a global hub which is used by the virus to coordinate the lytic cascade.


Conflict of interest statement

The authors have declared that no competing interests exist.

Figures

Figure 1
Figure 1. CBF1 proficient and deficient human B cell lines infected with recombinant KSHV maintain the viral genome and express viral latent genes when cultivated in selective media.
DG75 wt and DG75 CBF1 ko cells were infected with recombinant rKSHV.219 virus at a MOI of 5. (A) GFP expression of DG75 wt and DG75 CBF1 ko cells infected with rKSHV.219 was analyzed by flow cytometry 1, 2, 4, 6, and 12 weeks post infection. Three independent experiments were performed and one representative experiment is shown. (B) rKSHV.219 infected DG75 wt (K-DG75 wt) and DG75 CBF1 ko (K-DG75 CBF1 ko) cells were transferred to puromycin free medium and analyzed for GFP expression by flow cytometry after 0, 1, 2, 4, 6, 8, and 10 weeks. Two independent experiments were performed and one representative experiment is shown. (C) Genomic DNA from BCBL-1, BC-1 and two independently generated K-DG75 wt and K-DG75 CBF1 ko cell lines (designated a and b) was used to quantify intracellular KSHV copy numbers by real-time PCR using primers specific for the ORF50 promoter and normalized to β-actin gene fragments. Results are presented as mean values calculated from 2 independent experiments. (D) Transcript levels of ORF73/LANA and K10.5/vIRF3 were determined by real-time RT-PCR analyses of DG75, BCBL-1, BC-1, K-DG75 wt and K-DG75 CBF1 ko cell lines. Results were normalized to β-actin transcript levels and are presented as mean values calculated from 2 independent experiments.
Figure 2
Figure 2. CBF1 deficient KSHV infected B cells initiate lytic reactivation but fail to produce detectable levels of infectious virus.
(A) Six independent K-DG75 wt and K-DG75 CBF1 ko cell lines were treated with 3 mM NaB for 32 h and analyzed for GFP and RFP expression by flow cytometry. (B) K-DG75 wt and K-DG75 CBF1 ko cells were treated with increasing amounts of NaB and TPA for 32 h and analyzed for GFP and RFP expression. (A and B) Results are displayed as percentage of lytically reactivated cells as determined by RFP expression and are given as mean values of 2 independent experiments. For the following experiments (C, D, E and F) K-DG75 wt and K-DG75 CBF1 ko cells were treated with 10 mM NaB and 20 ng/ml TPA. (C) RFP/GFP+ and RFP+/GFP+ cells were separated by cell sorting 32 h post induction of the lytic cycle by TPA/NaB treatment. Genomic DNA of both populations was analyzed for viral copy numbers by real-time PCR. The increase of viral copy numbers of lytically reactivated RFP+/GFP+ cells compared to latent RFP/GFP+ cells is shown. The results represent two independent experiments performed in duplicates. (D and E) Four days post chemical induction the virus supernatants of two K-DG75 wt and K-DG75 CBF1 ko cells (designated a and b) were harvested, concentrated and used to infect HEK293 cells. The HEK293 cells were cultivated in the absence or presence of puromycin for 48 h and analyzed for GFP expression by fluorescence microscopy and flow cytometry. (D) Phase contrast and fluorescence microscopy images of untreated and viral supernatant treated HEK293 cells. Numbers in the lower panels indicate the percentage of GFP positive HEK293 cells as determined by flow cytometry. (E) Viability of infected HEK293 cells was measured by flow cytometry using forward and sideward scatter. Numbers indicate the average percentage of living (black) and dead (red) cells as determined in 3 independent experiments. (F) Virion associated extracellular viral genome copy numbers of concentrated cell culture supernatants obtained from non-induced or induced BC-1, K-DG75 wt and K-DG75 CBF1 ko cells were determined by real-time PCR. Results are presented as mean values calculated from 2 independent experiments.
Figure 3
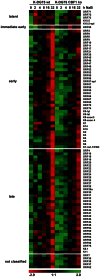
Figure 3. Genome-wide viral gene expression profiles of CBF1 proficient and deficient KSHV infected B cells.
K-DG75 wt and K-DG75 CBF1 ko cells were treated with 3 mM NaB for 0, 2, 4, 8, 16, or 32 hours. Total RNA was harvested, enriched for the poly-adenylated fraction and transcribed into cDNA. Viral transcripts were quantified by real-time PCR and normalized to β-actin . Viral gene expression patterns are shown as dCt values (Ct post lytic induction for individual time span - Ct prior lytic induction) in a heat map presentation after normalization to β-actin expression. Induction of viral genes results in negative dCt values. Negative dCt values represent high expression levels and are marked in red, intermediate expression levels are marked in black and positive values represent low expression levels and are marked in green. Vertical columns represent data obtained for serial time points post chemical induction for CBF1 proficient and deficient K-DG75 cells. Horizontal rows represent data for all tested KSHV genes. The heat map is split according to their classification into latent (n = 5), immediate early (n = 1), early (n = 40) and late (n = 35) genes and viral genes which have not yet been classified (n = 5) as reviewed .
Figure 4
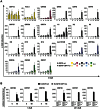
Figure 4. Confirmation of gene expression patterns for selected viral genes in CBF1 proficient and deficient K-DG75 cells.
(A) The expression levels of 21 selected KSHV genes which are active in the latent state or different phases of the lytic cycle (ORF73/LANA, K10.5/vIRF3 (latent, LA), ORF50/RTA (immediate early, IE), ORF6, ORF8, ORF9, ORF57, ORF59, ORF74, K1, K2, K5, nut-1/PAN, K8, K10, K14 (early, E), ORF4, ORF29a, ORF65 (late, L), ORF37 and ORF62 (not classified, n.c.)) were determined by real-time RT-PCR analysis using primers distinct from the set of primers used for the genome-wide PCR array. Results were normalized to cellular β-actin expression and presented as x-fold increase post induction by 3 mM NaB for the indicated time periods. The results are shown as the mean values of 2 experiments performed with 2 independent cell lines. (B) K-DG75 wt and K-DG75 CBF1 ko cells were treated with 3 mM NaB for 48 h and relative transcript levels for ORF50/RTA, ORF57 and ORF59 were determined by real-time RT-PCR before and after treatment (left panels). A fraction of the chemically treated cells was separated into uninduced RFP/GFP+ and induced RFP+/GFP+ populations and again transcript levels were determined (right panels). Two independent experiments were performed and mean values of duplicate PCR reactions of a representative experiment are shown.
Figure 5
Figure 5. Ectopic expression of CBF1 rescues induction of lytic viral genes in K-DG75 CBF1 ko cells.
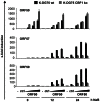
K-DG75 CBF1 ko cells were stably transfected with an expression vector for Flag-tagged CBF1 (tet-CBF1) under the control of a bidirectional promoter, which allows the simultaneous expression of NGF-receptor (NGF-R) and Flag-CBF1, or transfected with a control vector (tet-ctrl). Stable cell lines were cultivated in the presence of doxycycline or left untreated. Untransfected (−) K-DG75 wt and CBF1 ko cells are shown for comparison. (A) The expression of NGF-R was monitored by flow cytometry. (B and C) The cells were treated with 3 mM NaB. (B) 30 µg of total cellular protein extract of K-DG75 wt or CBF1 ko cells or 10 µg of protein extract of doxycycline induced K-DG75 CBF1 ko tet-CBF1 and tet-ctrl cells were analyzed by immunoblotting using CBF1, Flag or GAPDH specific antibodies. (C) The transcript levels of ORF50/RTA, ORF57, ORF59, ORF29a, ORF65 and ORF4 were determined by real-time RT-PCR. Results are shown as x-fold induction compared to values obtained from cells not treated with NaB. Results are given as mean values for data obtained from 2 independent experiments.
Figure 6
Figure 6. Ectopic expression of ORF50 does not rescue ORF57 and ORF59 expression in CBF1 deficient K-DG75 B cells.
1×10⁷ K-DG75 wt or K-DG75 CBF1 ko cells were transiently transfected with increasing amounts of an ORF50/RTA expression construct (15, 30 and 60 µg), the corresponding control vector (ctrl) or left non-transfected (−). 24 h post transfection cells were cultured with 3 mM NaB for 12 or 24 h. The transcript levels for ORF50/RTA, ORF57 and ORF59 were determined by real-time RT-PCR. Results are shown as x-fold induction compared to values obtained from non-transfected and uninduced cells. Three independent experiments were performed and mean values of duplicates of a representative experiment are shown.
Figure 7
Figure 7. The late viral genes ORF29a and ORF65 are CBF1 dependent ORF50/RTA target genes.
(A) 5×10⁶ KSHV negative DG75 wt or CBF1 ko cells were cotransfected with increasing amounts (0.05, 0.1, 0.5 and 1 µg) of ORF50/RTA expression or control vectors (pHACR3) and 3 µg of a luciferase promoter reporter construct containing a fragment of 1000 bp upstream of the translational initiation codon of the KSHV genes ORF59-p, ORF9-p, ORF29a-p, ORF62-p and ORF65-p. (B) KSHV negative DG75 CBF1 ko cells were cotransfected with 0.1 µg of a ORF50/RTA expression vector, 5 µg of a CBF1 expression vector or a control vector (pHACR3) and 3 µg of the ORF59, ORF29a-p and ORF65-p luciferase promoter reporter constructs. The ORF29a-p promoter constructs were cotransfected with 0.5 µg of the ORF50/RTA. The results in (A) and (B) represent means ± standard deviations derived from two independent experiments performed in triplicates. They are shown as x-fold induction compared to promoter activation by control vector and normalized to ß-galactosidase activity. The significance of changes of the promoter activities in the absence of CBF1 was calculated by student's t test (*p = 0.05–0.01, **p<0.01 or ***p<0.005). (C) Chromatin immunoprecipitation with CBF1 specific antibodies was performed to analyze CBF1 binding to promoters of the cellular CD23 gene, a well characterized CBF1 target, and the viral ORF29a and ORF65 promoters. As control, chromatin of KSHV negative DG75 cells was included. Co-immunopreciptiated DNA fragments were subsequently quantified by real-time PCR. Enrichment of CBF1 on specific genomic regions was calculated as percentage of the immunoprecipitated DNA compared to input DNA after subtraction of the isotype control signal and normalization to actin. The data represent the mean value of 3 independent experiments.

Similar articles

Cited by

References

    1. Cesarman E, Moore PS, Rao PH, Inghirami G, Knowles DM, et al. (1995) In vitro establishment and characterization of two acquired immunodeficiency syndrome-related lymphoma cell lines (BC-1 and BC-2) containing Kaposi's sarcoma-associated herpesvirus-like (KSHV) DNA sequences. Blood 86: 2708–2714. - PubMed
    1. Ambroziak JA, Blackbourn DJ, Herndier BG, Glogau RG, Gullett JH, et al. (1995) Herpes-like sequences in HIV-infected and uninfected Kaposi's sarcoma patients. Science 268: 582–583. - PubMed
    1. Speck SH, Ganem D (2010) Viral latency and its regulation: lessons from the gamma-herpesviruses. Cell Host Microbe 8: 100–115. - PMC - PubMed
    1. Chandran B (2010) Early events in Kaposi's sarcoma-associated herpesvirus infection of target cells. J Virol 84: 2188–2199. - PMC - PubMed
    1. Guito J, Lukac DM (2012) KSHV Rta Promoter Specification and Viral Reactivation. Front Microbiol 3: 30. - PMC - PubMed

Publication types

MeSH terms

Substances

LinkOut - more resources