A role for the nucleosome assembly proteins TAF-Iβ and NAP1 in the activation of BZLF1 expression and Epstein-Barr virus reactivation
- PMID: 23691099
- PMCID: PMC3653829
- DOI: 10.1371/journal.pone.0063802
A role for the nucleosome assembly proteins TAF-Iβ and NAP1 in the activation of BZLF1 expression and Epstein-Barr virus reactivation
Abstract
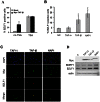
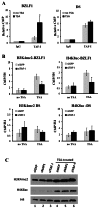
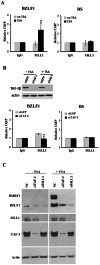
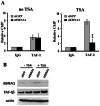
The reactivation of Epstein-Barr virus (EBV) from latent to lytic infection begins with the expression of the viral BZLF1 gene, leading to a subsequent cascade of viral gene expression and amplification of the EBV genome. Using RNA interference, we show that nucleosome assembly proteins NAP1 and TAF-I positively contribute to EBV reactivation in epithelial cells through the induction of BZLF1 expression. In addition, overexpression of NAP1 or the β isoform of TAF-I (TAF-Iβ) in AGS cells latently infected with EBV was sufficient to induce BZLF1 expression. Chromatin immunoprecipitation experiments performed in AGS-EBV cells showed that TAF-I associated with the BZLF1 promoter upon lytic induction and affected local histone modifications by increasing H3K4 dimethylation and H4K8 acetylation. MLL1, the host protein known to dimethylate H3K4, was found to associate with the BZLF1 promoter upon lytic induction in a TAF-I-dependent manner, and MLL1 depletion decreased BZLF1 expression, confirming its contribution to lytic reactivation. The results indicate that TAF-Iβ promotes BZLF1 expression and subsequent lytic infection by affecting chromatin at the BZLF1 promoter.
Conflict of interest statement
Figures


Similar articles
-
Epigenetic histone modification of Epstein-Barr virus BZLF1 promoter during latency and reactivation in Raji cells.J Virol. 2012 May;86(9):4752-61. doi: 10.1128/JVI.06768-11. Epub 2012 Feb 22. J Virol. 2012. PMID: 22357272 Free PMC article.
-
Viral genome methylation differentially affects the ability of BZLF1 versus BRLF1 to activate Epstein-Barr virus lytic gene expression and viral replication.J Virol. 2013 Jan;87(2):935-50. doi: 10.1128/JVI.01790-12. Epub 2012 Nov 7. J Virol. 2013. PMID: 23135711 Free PMC article.
-
Histone acetylation and reactivation of Epstein-Barr virus from latency.J Virol. 2000 Jan;74(2):710-20. doi: 10.1128/jvi.74.2.710-720.2000. J Virol. 2000. PMID: 10623733 Free PMC article.
-
Regulation of Epstein-Barr virus reactivation from latency.Microbiol Immunol. 2014 Jun;58(6):307-17. doi: 10.1111/1348-0421.12155. Microbiol Immunol. 2014. PMID: 24786491 Review.
-
Switching of EBV cycles between latent and lytic states.Rev Med Virol. 2014 May;24(3):142-53. doi: 10.1002/rmv.1780. Epub 2013 Dec 11. Rev Med Virol. 2014. PMID: 24339346 Review.
Cited by
-
The next decade of SET: from an oncoprotein to beyond.J Mol Cell Biol. 2024 Jul 1;16(1):mjad082. doi: 10.1093/jmcb/mjad082. J Mol Cell Biol. 2024. PMID: 38157418 Free PMC article. Review.
-
Epstein-Barr virus lytic reactivation regulation and its pathogenic role in carcinogenesis.Int J Biol Sci. 2016 Oct 18;12(11):1309-1318. doi: 10.7150/ijbs.16564. eCollection 2016. Int J Biol Sci. 2016. PMID: 27877083 Free PMC article. Review.
-
Identification of ARKL1 as a Negative Regulator of Epstein-Barr Virus Reactivation.J Virol. 2019 Sep 30;93(20):e00989-19. doi: 10.1128/JVI.00989-19. Print 2019 Oct 15. J Virol. 2019. PMID: 31341047 Free PMC article.
-
Eviction of linker histone H1 by NAP-family histone chaperones enhances activated transcription.Epigenetics Chromatin. 2015 Sep 4;8:30. doi: 10.1186/s13072-015-0022-8. eCollection 2015. Epigenetics Chromatin. 2015. PMID: 26339295 Free PMC article.
-
Assembly and remodeling of viral DNA and RNA replicons regulated by cellular molecular chaperones.Biophys Rev. 2018 Apr;10(2):445-452. doi: 10.1007/s12551-017-0333-z. Epub 2017 Nov 22. Biophys Rev. 2018. PMID: 29170971 Free PMC article. Review.
References
-
- Kieff E, Rickinson AB (2001) Epstein-Barr virus and its replication. In: Knipe DM, Howley PM, editors. Fields Virology. Philadelphia: Lippincott Williams and Wilkins. 2511–2573.
-
- Liu S, Borras AM, Liu P, Suske G, Speck SH (1997) Binding of the ubiquitous cellular transcription factors Sp1 and Sp3 to the ZI domains in the Epstein-Barr virus lytic switch BZLF1 gene promoter. Virology 228: 11–18. - PubMed
-
- Miller G, El-Guindy A, Countryman J, Ye J, Gradoville L (2007) Lytic cycle switches of oncogenic human gammaherpesviruses(1). Adv Cancer Res 97: 81–109. - PubMed
Publication types
MeSH terms
Substances
Grants and funding
LinkOut - more resources
Full Text Sources
Other Literature Sources
Molecular Biology Databases

