. 2013 Jun;15(6):700-11.
doi: 10.1038/ncb2748. Epub 2013 May 19.

Subtelomeric hotspots of aberrant 5-hydroxymethylcytosine-mediated epigenetic modifications during reprogramming to pluripotency

Affiliations

Subtelomeric hotspots of aberrant 5-hydroxymethylcytosine-mediated epigenetic modifications during reprogramming to pluripotency

Tao Wang et al. Nat Cell Biol. 2013 Jun.

Abstract

Mammalian somatic cells can be directly reprogrammed into induced pluripotent stem cells (iPSCs) by introducing defined sets of transcription factors. Somatic cell reprogramming involves epigenomic reconfiguration, conferring iPSCs with characteristics similar to embryonic stem cells (ESCs). Human ESCs (hESCs) contain 5-hydroxymethylcytosine (5hmC), which is generated through the oxidation of 5-methylcytosine by the TET enzyme family. Here we show that 5hmC levels increase significantly during reprogramming to human iPSCs mainly owing to TET1 activation, and this hydroxymethylation change is critical for optimal epigenetic reprogramming, but does not compromise primed pluripotency. Compared with hESCs, we find that iPSCs tend to form large-scale (100 kb-1.3 Mb) aberrant reprogramming hotspots in subtelomeric regions, most of which exhibit incomplete hydroxymethylation on CG sites. Strikingly, these 5hmC aberrant hotspots largely coincide (~80%) with aberrant iPSC-ESC non-CG methylation regions. Our results suggest that TET1-mediated 5hmC modification could contribute to the epigenetic variation of iPSCs and iPSC-hESC differences.


Figures
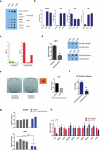
Figure 1
Figure 1. TET1 is associated with increased hydroxymethylation during human iPSC reprogramming
(a) Measurement of 5hmC levels in genomic DNAs from fibroblasts, hiPSCs and hESCs by dot blot using anti-5hmC antibody. Mouse cerebellum genomic DNA was used as a control. 225 ng, 450 ng and 1000 ng DNA were used for each sample. (b) Quantitative RT-PCR to detect mRNA levels of TET1, TET2, TET3 and NANOG in fibroblasts (CRL2097) and hiPSCs (iPSC-B21, iPSC-B22). Error bars represent the standard error of the mean (S.E.M.) collected from three independent experiments. (c) Boxplot of transcript copy numbers of TET1, TET2, TET3, and NANOG in IMR90 (fibroblasts) and H1 (hESCs) represented by RPKM in RNA-seq. (d) Knocking down TET1 by siRNA significantly decreases 5hmC levels in hiPSCs. Left panel represents siTET1 knock down efficiency by quantitative RT-PCR (* t-test, p<0.05). Right panel depicts the effect of total 5hmC levels 48hours post siTET1 transfection. Error bars represent S.E.M. collected from three independent experiments. (e) Alkaline phosphatase (AP) staining of reprogrammed cells treated either with shTET1 lentivirus or an equal titer shControl lentivirus after O,S,K,M retroviral transduction of 100,000 CRL2097 cells on day 20. Cells used for staining were grown in 10 cm dishes. The image on the right shows a representative AP positive colony and TET1 transcript level in shTET1- or shControl-treated cells 10 days post transduction in one representative experiment of three independent experiments. Scale bars: 300 μm. (f) Summary of quantitative analysis of AP-positive colonies in three different experiments (* t-test, p<0.05). Controls were normalized to 100%. Error bars represent the standard deviation (SD). (g) Real time PCR analysis of TET1 and pluripotency marker NANOG. shTET1-treated reprogrammed colonies maintained normal levels of NANOG, but shows decreased TET1 expression (* t-test, p<0.05). Colonies were picked and maintained in puromycin medium (0.5 μg/ml) on puromycin resistant MEFs. (h) Real time PCR analysis of normalized gene expression levels of TET1 and selected pluripotency related factors in stable shTET1 or shControl iPS-B22 cells under the puromycin selection (0.5 μg/ml) (*** t-test, p<0.05). Error bars represent the S.E.M. of three independent experiments. The raw values of related statistical test in this figure are listed in Supplementary Table S1.
Figure 2
Figure 2. Reprogramming confers a 5hmC epigenome in a pattern with a bias towards telomere proximal regions in autosomes
(a) Pearson correlation analysis and cluster among fibroblasts and fibroblast derived iPSCs. The values close to 1 indicate greater similarity. (b) Summary of the numbers of 5hmC differentially modified between fibroblasts and iPSCs, indicated by hyperDhMR (iPSCs>Fibroblast) and hypoDhMR (iPSCs<Fibroblast). The regions enriched either in fibroblasts or in iPSCs were subjected to DhMR calling. 5hmC-enriched regions in 3 fibroblast lines and 5 fibroblast-derived iPSC lines were coalesced into a union window. Then the reads in these windows were recounted and normalized to the total read count from the respective cell line. 267,664 DhMRs were called with a FDR of 0.01 by the Bioconductor Deseq package, which uses a negative binomial model for testing differential expression of sequencing data. Among them, 231,866 are hyperDhMRs, and 35,798 are hypoDhMRs. (c) Composite 5hmC enrichment profile for fibroblasts and iPSCs in the upstream regions of DhMRs, DhMRs, and downstream regions of DhMRs. The length for upstream and downstream of DhMRs is 5kb. (d) Chromosome ideograms showing the genome-wide distribution of the top 20,000 Fib-iPSC-DhMRs ranked by lowest adjusted p-value. Blue lines indicate location of DhMRs. (e) Observed and expected numbers of hyperDhMRs occurring at telomere-proximal regions (chi-square test, p value<0.00001). Telomere-proximal regions were defined as regions at either end of a chromosome with a length equal to 1/20th of the total length of that chromosome. The observed number occurring at telomere-proximal regions is called by overlapping with top 20,000 hyperDhMRs. The expected number is calculated based on the proportion of total telomere-proximal region length compared to the whole length of all chromosomes. The top 20,000 hyperDhMRs were based on the 5hmC profiles of 3 fibroblast lines and 5 fibroblast-derived iPSC lines. (f) The distribution of the top 20,000 Fib-iPSC-hyperDhMRs in Chr1 and ChrX.
Figure 3
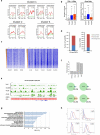
Figure 3. 5hmC is associated with gene activity and pluripotency regulatory networks in stem cells
(a) 3 distinct clusters of 5hmC-density pattern at TSS regions (+/− 3kb) in iPSCs and fibroblasts among 9 categories. The 9 categories were classified based on the gene expression changes between iPS cells and fibroblasts: Category 1: high expression in iPS cells, low expression in fibroblast; Category 2: medium expression in iPS cells, low expression in fibroblast, etc. (b) Box plots of hydroxymethylation levels in TSS regions and Gene bodies among the three clusters. *** indicates significantly more 5hmC levels compared with all others (P < 0.001, Wilcoxon rank test). Similarly, * indicates lowest 5hmC levels, ** indicated intermediate 5hmC level. (c) 5hmC enrichment density heatmap. Genes were ordered by expression level from high to low as determined by H1 RPKM. The TSS and direction of transcription of genes are indicated by the genomic region from –3kb to +3kb and an arrow. The TES is indicated by the genomic region from –3kb to +3kb and vertical lines. The left part of the panel shows genes in fibroblasts, the right part shows the genes in iPSCs. (d) The correlation between PMD (methylation level is higher in stem cells) and DhMRs, and the correlation between hypoDMRs (methylation level is lower in stem cells) and DhMRs. (e) 5hmC density at the NANOG locus in input, iPSCs, and fibroblast cell lines. The position of the loci within the chromosome and the scale are shown above the gene tracks. Black lines indicate the DhMRs. (f) The overlap between NANOG, OCT4, KLF4, SOX2 binding sites in ES cells and 5hmC significant change regions, shown are observed-to-expected ratios. Lower panel shows the overlapping percentage of each binding sites. (g) Gene ontology analysis for genes overlapped with most significant DhMRs. (h) Plot of hyperDhMR and hypoDhMR densities in the context of C+G percent, CG percent, CH percent and CHG percent.
Figure 4
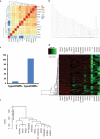
Figure 4. Aberrant 5hmC reprogramming hotspots cluster at subtelomeric regions
(a) Pearson correlation analysis and clustering among 9 iPSCs and hESCs. Values close to 1 indicate greater similarity. (b) Chromosome ideograms showing the genome-wide distribution of 113 iPSC-ES DhMRs. Red lines indicate locations of DhMRs. (c) The number of iPS-ES-hyperDhMRs and iPS-ES-hypoDhMRs. The 372,423 5hmC-enriched regions either in 9 iPSC lines or 4 hESC lines were subjected to DhMR calling by Bioconductor Deseq package. This analysis led to the identification of 113 iPS-ES-DhMRs that were differentially hydroxymethylated in at least one iPS cell or ES cell line (FDR<0.01). 105 of the 113 iPS-ES DhMRs are hypo-hydroxymethylated, with 5hmC levels similar to their respective progenitors. (d) Complete linkage hierarchical clustering of 5hmC density within the iPS-ES-DhMRs. The raw count values are scaled by rows during clustering. (e) Hierarchical cluster analysis using the top 1,000 most variable 5hmC enriched regions across all iPSC and hESC samples. Arrow indicates hESCs.
Figure 5
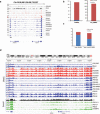
Figure 5. 5hmC DhMRs largely overlap with non-CG-DMRs in a large-scale pattern
(a) 5hmC density at the iPS-ES-DhMR SIGLEC6, SIGLEC12 locus, in fibroblast (CRL2097), blood, iPS, and ES cell lines. The position of the loci within the chromosome and the scale are shown above the gene tracks. Black bars indicate DhMRs. (b) The number of 5hmC DhMRs that overlaps with CG-DMRs. CG-DMRs were categorized by methylation state relative to the ES cells. (c) The number of 5hmC large-scale hypoDhMRs that overlap with nonCG-DMRs. NonCG-DMRs were categorized by methylation state relative to the ES cells reported previously. The overlap was called if overlapping length is larger than 1 kb. First bar summarizes the overlap for large-scale hypoDhMRs with hypo-nonCG-DMRs. The second bar summarizes the overlap for hypo-nonCG-DMRs with large-scale hypoDhMRs. The blue colour represents overlap between nonCG-DMR and hypoDhMRs. The red colour represents no overlap. (d) 5hmC density at of iPS-ES-DhMR TCERG1L locus in fibroblast (CRL2097), blood, iPS, and ES cell lines. The position of the loci within the chromosome and the scale are shown above the gene tracks. Lower parts shows the 5mC levels in CH studied by Lister et al, black colour indicates H1 stem cells, green depicts iPSCs.
Figure 6
Figure 6. Large-scale incomplete hydroxymethylation hotspots are characteristics of human iPS cells
(a) Distribution of 20 5hmC large-scale DhMRs in iPSCs and ESs respectively. Green colour: 9 iPS cell relative enrichment counts, Red colour: 4 hESC cell relative enrichment counts. Solid vertical line separates hyperDhMRs and hypoDhMRs. (b) Summary of 19 hypo large-scale DhMRs in each iPSC line. Blue colour indicates regions have similar 5hmC level compared with ES cells, red colour indicates a lower 5hmC level than ES cells. 5hmC levels were determined by counting 5hmC Capture-Seq reads within each hypo large-scale DhMRs for each cell line. A lower 5hmC level in iPS cells was determined by the criteria that 5hmC levels were less than three standard deviations from the mean among ES cells; if levels were within three standard deviations, the region was considered having similar 5hmC levels.
Figure 7
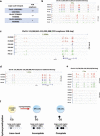
Figure 7. Large-scale hotspots are caused predominantly by aberrant CpG hydroxymethylation
(a) Summary of PCR based TAB-Seq. (b) 5hmC+5mC single base density in one of the amplicons by traditional bisulfite sequencing in 2 hESC and 2 iPSC lines. Bisulfite sequencing shows the CH methylation (or methylation plus hydroxymethylation) variation in iPS cells. The position of the loci within the chromosome and the scale are shown above the gene tracks. (c) 5hmC single base density on CG sites in 15 amplicons by TAB-Seq in 2 human ES cells 4 iPS cell lines. iPS-B22 and B23 shows incomplete CG hydroxymethylation. Green colour indicates iPSCs bearing same hydroxymethylation detected by 5hmC Capture-Seq. Blue colour indicates iPSCs bearing incomplete hydroxymethylation detected by 5hmC Capture-Seq in this region. (d) 5hmC+5mC single base density in 15 amplicons by traditional bisulfite sequencing in 2 hESC and 2 iPSC lines. (e) 5hmC single base density on CG dinucleotides and CH dinucleotides in one of the amplicons that are marked by blackdot in (c) by TAB-Seq in 2 human ES and 4 iPS cell lines. Green colour indicates iPSCs bearing the same hydroxymethylation detected by 5hmC Capture-Seq. Blue colour indicates iPSCs bearing incomplete hydroxymethylation detected by 5hmC Capture-Seq in this region. (f) Schematic summary of large scale incomplete hydroxymethylation on CG dinucleotides in iPS cells.

Comment in

Similar articles

Cited by

References

    1. Takahashi K, et al. Induction of pluripotent stem cells from adult human fibroblasts by defined factors. Cell. 2007;131:861–872. - PubMed
    1. Takahashi K, Yamanaka S. Induction of pluripotent stem cells from mouse embryonic and adult fibroblast cultures by defined factors. Cell. 2006;126:663–676. - PubMed
    1. Yu J, et al. Induced pluripotent stem cell lines derived from human somatic cells. Science. 2007;318:1917–1920. - PubMed
    1. Tahiliani M, et al. Conversion of 5-methylcytosine to 5-hydroxymethylcytosine in mammalian DNA by MLL partner TET1. Science. 2009;324:930–935. - PMC - PubMed
    1. Kriaucionis S, Heintz N. The nuclear DNA base 5-hydroxymethylcytosine is present in Purkinje neurons and the brain. Science. 2009;324:929–930. - PMC - PubMed

Publication types

MeSH terms

Associated data