Relaxation response induces temporal transcriptome changes in energy metabolism, insulin secretion and inflammatory pathways
- PMID: 23650531
- PMCID: PMC3641112
- DOI: 10.1371/journal.pone.0062817
Relaxation response induces temporal transcriptome changes in energy metabolism, insulin secretion and inflammatory pathways
Erratum in
-
Correction: Relaxation Response Induces Temporal Transcriptome Changes in Energy Metabolism, Insulin Secretion and Inflammatory Pathways.PLoS One. 2017 Feb 21;12(2):e0172873. doi: 10.1371/journal.pone.0172873. eCollection 2017. PLoS One. 2017. PMID: 28222196 Free PMC article.
Abstract
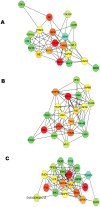
The relaxation response (RR) is the counterpart of the stress response. Millennia-old practices evoking the RR include meditation, yoga and repetitive prayer. Although RR elicitation is an effective therapeutic intervention that counteracts the adverse clinical effects of stress in disorders including hypertension, anxiety, insomnia and aging, the underlying molecular mechanisms that explain these clinical benefits remain undetermined. To assess rapid time-dependent (temporal) genomic changes during one session of RR practice among healthy practitioners with years of RR practice and also in novices before and after 8 weeks of RR training, we measured the transcriptome in peripheral blood prior to, immediately after, and 15 minutes after listening to an RR-eliciting or a health education CD. Both short-term and long-term practitioners evoked significant temporal gene expression changes with greater significance in the latter as compared to novices. RR practice enhanced expression of genes associated with energy metabolism, mitochondrial function, insulin secretion and telomere maintenance, and reduced expression of genes linked to inflammatory response and stress-related pathways. Interactive network analyses of RR-affected pathways identified mitochondrial ATP synthase and insulin (INS) as top upregulated critical molecules (focus hubs) and NF-κB pathway genes as top downregulated focus hubs. Our results for the first time indicate that RR elicitation, particularly after long-term practice, may evoke its downstream health benefits by improving mitochondrial energy production and utilization and thus promoting mitochondrial resiliency through upregulation of ATPase and insulin function. Mitochondrial resiliency might also be promoted by RR-induced downregulation of NF-κB-associated upstream and downstream targets that mitigates stress.
Conflict of interest statement
Figures


Similar articles
-
Psychobiological changes from relaxation response elicitation: long-term practitioners vs. novices.Psychosomatics. 2011 Nov-Dec;52(6):550-9. doi: 10.1016/j.psym.2011.05.001. Psychosomatics. 2011. PMID: 22054625
-
Genomic and clinical effects associated with a relaxation response mind-body intervention in patients with irritable bowel syndrome and inflammatory bowel disease.PLoS One. 2015 Apr 30;10(4):e0123861. doi: 10.1371/journal.pone.0123861. eCollection 2015. PLoS One. 2015. PMID: 25927528 Free PMC article. Clinical Trial.
-
Specific Transcriptome Changes Associated with Blood Pressure Reduction in Hypertensive Patients After Relaxation Response Training.J Altern Complement Med. 2018 May;24(5):486-504. doi: 10.1089/acm.2017.0053. Epub 2018 Apr 4. J Altern Complement Med. 2018. PMID: 29616846 Free PMC article. Clinical Trial.
-
Meditation therapy for anxiety disorders.Cochrane Database Syst Rev. 2006 Jan 25;(1):CD004998. doi: 10.1002/14651858.CD004998.pub2. Cochrane Database Syst Rev. 2006. PMID: 16437509 Review.
-
Longevity: potential life span and health span enhancement through practice of the basic yoga meditation regimen.Ann N Y Acad Sci. 2009 Aug;1172:20-7. doi: 10.1111/j.1749-6632.2009.04538.x. Ann N Y Acad Sci. 2009. PMID: 19735236 Review.
Cited by
-
Effects of relaxation on depression levels in women with high-risk pregnancies: a randomised clinical trial.Rev Lat Am Enfermagem. 2016 Sep 9;24(0):e2806. doi: 10.1590/1518-8345.1249.2806. Rev Lat Am Enfermagem. 2016. PMID: 27627126 Free PMC article. Clinical Trial.
-
Meditation and vacation effects have an impact on disease-associated molecular phenotypes.Transl Psychiatry. 2016 Aug 30;6(8):e880. doi: 10.1038/tp.2016.164. Transl Psychiatry. 2016. PMID: 27576169 Free PMC article. Clinical Trial.
-
Comprehensive Review of Chronic Stress Pathways and the Efficacy of Behavioral Stress Reduction Programs (BSRPs) in Managing Diseases.Int J Environ Res Public Health. 2024 Aug 16;21(8):1077. doi: 10.3390/ijerph21081077. Int J Environ Res Public Health. 2024. PMID: 39200687 Free PMC article. Review.
-
Complementary or alternative medicine in cancer care-myths and realities.Nat Rev Clin Oncol. 2013 Nov;10(11):656-64. doi: 10.1038/nrclinonc.2013.125. Epub 2013 Jul 30. Nat Rev Clin Oncol. 2013. PMID: 23897081 Review.
-
A Call to Use the Multicomponent Exercise Tai Chi to Improve Recovery From COVID-19 and Long COVID.Front Public Health. 2022 Feb 28;10:827645. doi: 10.3389/fpubh.2022.827645. eCollection 2022. Front Public Health. 2022. PMID: 35296042 Free PMC article.
References
-
- Benson H, Beary JF, Carol MP (1974) The relaxation response. Psychiatry 37: 37–46. - PubMed
-
- Benson H (1975) The Relaxation Response: HarperCollins.
-
- Cohen S, Janicki-Deverts D, Miller GE (2007) Psychological stress and disease. JAMA : the journal of the American Medical Association 298: 1685–1687. - PubMed
-
- Dusek JA, Hibberd PL, Buczynski B, Chang BH, Dusek KC, et al. (2008) Stress management versus lifestyle modification on systolic hypertension and medication elimination: a randomized trial. Journal of alternative and complementary medicine 14: 129–138. - PubMed
Publication types
MeSH terms
Substances
Grants and funding
LinkOut - more resources
Full Text Sources
Other Literature Sources
Medical

