. 2013 May 30;3(5):1476-82.
doi: 10.1016/j.celrep.2013.03.043. Epub 2013 May 2.

Inositol pyrophosphates regulate cell growth and the environmental stress response by activating the HDAC Rpd3L

Affiliations

Inositol pyrophosphates regulate cell growth and the environmental stress response by activating the HDAC Rpd3L

Jeremy Worley et al. Cell Rep. .

Abstract

Cells respond to stress and starvation by adjusting their growth rate and enacting stress defense programs. In eukaryotes this involves inactivation of TORC1, which in turn triggers downregulation of ribosome and protein synthesis genes and upregulation of stress response genes. Here we report that the highly conserved inositol pyrophosphate (PP-IP) second messengers (including 1-PP-IP5, 5-PP-IP4, and 5-PP-IP5) are also critical regulators of cell growth and the general stress response, acting in parallel with the TORC1 pathway to control the activity of the class I histone deacetylase Rpd3L. In fact, yeast cells that cannot synthesize any of the PP-IPs mount little to no transcriptional response to osmotic, heat, or oxidative stress. Furthermore, PP-IP-dependent regulation of Rpd3L occurs independently of the role individual PP-IPs (such as 5-PP-IP5) play in activating specialized stress/starvation response pathways. Thus, the PP-IP second messengers simultaneously activate and tune the global response to stress and starvation signals.


Figures

Fig. 1
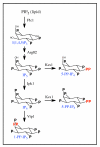
Fig. 1. The PP-IP synthesis pathway
See text for details.
Fig. 2
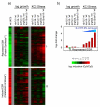
Fig. 2. The role of the Inositol Phosphates and Pyrophosphates in Gene Regulation
(a) DNA microarray data showing gene expression in log growth (YEPD, OD600= 0.6) or in response to osmotic stress (0.4 M KCl, 20 minutes) in strains missing one or more of the enzymes inositol polyphosphate/pyrophosphate (IP) synthesis pathway. Each experiment compares the mRNA levels in a mutant strain to those in the wild type strain, in identical conditions. In all of these experiments cDNA from mutant strains are labeled with Cy5 while the wild type strain is labeled with Cy3. Thus, genes that are upregulated in the mutant strains appear red while genes that are downregulated are green. The wild type stress response (osmotic stress sample labeled red, log growth labeled green) is shown at far left for comparison. The heat map shows data for all of the genes in the ESR based on the average of two to three replicate experiments per microarray (Table S1). Other genes regulated by the inositol phosphate pathway are described in the Supplement. Within the ESR, the correlation between the expression changes found in the kcs1Δvip1Δ strain and the arg82Δ strain are very strong, with a Pearson's r of 0.70 in YEPD, 0.77 for genes repressed in stress, and 0.63 for genes activated in stress. The correlation between the expression changes found in the kcs1Δvip1Δ and ipk1Δ strains are also strong for genes repressed in stress (r=0.69), but moderate in YEPD (r=0.45) and for genes activated in stress (r=0.49). Last, the expression changes found in the kcs1Δ and vip1Δ strains also correlate well with those found in the arg82Δ strain (r values ranging from 0.76 to 0.52, for the three gene groups listed above) except that there is little to no correlation between the influence of Vip1 and Arg82 in YEPD (r=0.12), suggesting that Vip1 is less important than Kcs1 for PP-IP synthesis in YEPD growth conditions. Overall, the strong correlation between the expression changes caused by deleting Kcs1 and Vip1, and removing their key substrates (IP5 and IP6) via deletion of Arg82 or Ipk1, indicates that it is the PP-IPs, and not other (unknown) molecules synthesized by Kcs1/Vip1, that regulate the ESR. (b) Bar graph showing the defect in Ribi gene repression for each mutant strain and condition in (a). Note that arg82Δ cells still produce some PP-IPs since Kcs1 phosphorylates and pyrophosphorylates IP3 to create PP-IP3, PP-IP4, and other PP-IP species, when IP5 and IP6 are not available as substrates (Seeds et al., 2005). Accordingly, the expected concentration of PP-IPs in kcs1Δvip1Δ < arg82Δ < kcs1Δ and ipk1Δ < vip1Δ (Fig. 1; Seeds et al., 2005).
Fig. 3
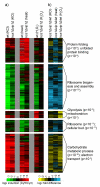
Fig. 3. Inositol pyrophosphates (PP-IPs) Regulate the Environmental Stress Response
DNA microarray data showing the gene expression programs activated in various stresses in wild type and kcs1Δvip1Δ strains. (a) Each column compares the mRNA levels in log growth conditions (YEPD, OD=0.6) to the mRNA levels in the same strain after 20 minutes of the indicated stress. In all of these experiments cDNA from cells collected prior to stress treatment were labeled with Cy3 (green) while cDNA from cells treated with stress stimuli were labeled with Cy5 (red). Thus, genes activated by 0.4M KCl, 42° C heat shock, or 0.4 mM H2O2 are red on the heat map while genes repressed in these stimuli are green. Only genes that are up or downregulated by >3-fold, in one or more experiment, are shown on the heat map. Clustering these data revealed five gene groups, each of which is labeled by its major gene ontology groups and the probability that a GO group was found by chance. Microarrays are the average of at least two replicates. (b) Each column shows the difference between the kcs1Δvip1Δ and wild-type response to the stress indicated to highlight the Kcs1 and Vip1 regulated genes.
Fig. 4
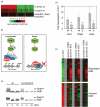
Fig. 4. Inositol Pyrophosphates Regulate Rpd3L
(a) Inositol pyrophosphates act at or below the level of TORC1. DNA microarray data showing genes up or downregulated >3-fold in response to 20 minutes of 0.4M KCl in wild type (top), or in kcs1Δvip1Δ strain (Cy3) compared to the same strain treated with 0.4M KCl and 300 nM rapamycin for 20 minutes (Cy5) (bottom). The gene expression changes induced by rapamycin in the wild-type strain are also shown for comparison (middle). If the PP-IPs acted upstream of TORC1 then treatment with rapmycin in stress would have rescued expression defect found in the kcs1Δvip1Δ strain, leading to dramatic changes in gene expression in rapamycin. Microarrays are the average of three replicates. (b) Known mechanism of stress induced repression of Ribosome Biogenesis (Ribi) genes. Inactivation of TORC1 leads to Tod6/Dot6 activation and recruitment of the histone deacetylase Rpd3L to Ribi promoters, as described in the text. (c) Stress signaling through the TORC1 pathway still occurs in the absence of the PP-IPs. The phosphorylation of Dot6-HA and Tod6-HA was monitored using band-shift analysis, both before and after treatment with 0.4M KCl. Here cells were treated with TCA, lysed and whole cell extracts run on SDS-PAGE. Dot6 and Tod6 were identified using a western blot with an anti-HA antibody (12-CA5). The band-shifts monitored here have previously been show to be due to phosphorylation by Sch9 (Huber et al., 2009). (d) PP-IPs are required for deacetylation at Ribi genes in 0.4M KCl stress. The acetylation level of three highly regulated Ribi genes was measured in the kcs1Δvip1Δ and wild-type strains, both before and after KCl stress, using an anti acetylated-H4 antibody and quantitative PCR. Plotted here is the ratio of the pre-stress to post-stress acetylation level. No significant changes in the pre-stress acetylation levels were found in the kcs1Δvip1Δ strain. However, stress triggers more deacetylation in the wild-type strain than it does in the kcs1Δvip1Δ strain; **(p<0.03) and *(p<0.1), t-test values for null hypothesis. (e) Rpd3, the PPIPs, and disrupting the inositol-phosphate binding site on Rpd3L have similar effects on the ESR. The DNA microarrays show the change of gene expression caused by deleting Rpd3, Kcs1 and Vip1, or mutating the inositol binding site in Rpd3 (rpd3Δibs), in both log growth and 0.4M KCl stress (after 20 min). In each case cDNA from the mutant strain is labeled with Cy5, while cDNA from the wild-type strain, grown in identical conditions, is labeled with Cy3.

Similar articles

Cited by

References

    1. Airoldi EM, Huttenhower C, Gresham D, Lu C, Caudy AA, Dunham MJ, Broach JR, Botstein D, Troyanskaya OG. Predicting cellular growth from gene expression signatures. Plos Comput Biol. 2009;5:e1000257. - PMC - PubMed
    1. Alejandro-Osorio AL, Huebert DJ, Porcaro DT, Sonntag ME, Nillasithanukroh S, Will JL, Gasch AP. The histone deacetylase Rpd3p is required for transient changes in genomic expression in response to stress. Genome Biol. 2009;10:R57. - PMC - PubMed
    1. Beck T, Hall MN. The TOR signalling pathway controls nuclear localization of nutrient-regulated transcription factors. Nature. 1999;402:402–689. - PubMed
    1. Berridge MJ, Lipp P, Bootman MD. The versatility and universality of calcium signalling. Nat Rev Mol Cell Biol. 2000;1:1–11. - PubMed
    1. Brauer MJ, Huttenhower C, Airoldi EM, Rosenstein R, Matese JC, Gresham D, Boer VM, Troyanskaya OG, Botstein D. Coordination of growth rate, cell cycle, stress response, and metabolic activity in yeast. Mol Biol Cell. 2008;19:19–352. - PMC - PubMed

Publication types

MeSH terms

Substances

Associated data