Phosphopeptide enrichment with TiO2-modified membranes and investigation of tau protein phosphorylation
- PMID: 23638980
- PMCID: PMC3721342
- DOI: 10.1021/ac400198n
Phosphopeptide enrichment with TiO2-modified membranes and investigation of tau protein phosphorylation
Abstract
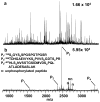
Selective enrichment of phosphopeptides prior to their analysis by mass spectrometry (MS) is vital for identifying protein phosphorylation sites involved in cellular regulation. This study describes modification of porous nylon substrates with TiO2 nanoparticles to create membranes that rapidly enrich phosphopeptides. Membranes with a 22-mm diameter bind 540 nmol of phosphoangiotensin and recover 70% of the phosphopeptides in mixtures with a 15-fold excess of nonphosphorylated proteins. Recovery is 90% for a pure phosphopeptide. Insertion of small membrane disks into HPLC fittings allows rapid enrichment from 5 mL of 1 fmol/μL phosphoprotein digests and concentration into small-volume (tens of microliters) eluates. The combination of membrane enrichment with tandem mass spectrometry reveals seven phosphorylation sites from in vivo phosphorylated tau (p-tau) protein, which is associated with Alzheimer's disease.
Figures


Similar articles
-
The Use of Titanium Dioxide for Selective Enrichment of Phosphorylated Peptides.Methods Mol Biol. 2016;1355:135-46. doi: 10.1007/978-1-4939-3049-4_9. Methods Mol Biol. 2016. PMID: 26584923
-
Improved titanium dioxide enrichment of phosphopeptides from HeLa cells and high confident phosphopeptide identification by cross-validation of MS/MS and MS/MS/MS spectra.J Proteome Res. 2007 Nov;6(11):4150-62. doi: 10.1021/pr070152u. Epub 2007 Oct 9. J Proteome Res. 2007. PMID: 17924679
-
Highly robust, automated, and sensitive online TiO2-based phosphoproteomics applied to study endogenous phosphorylation in Drosophila melanogaster.J Proteome Res. 2008 Feb;7(2):687-97. doi: 10.1021/pr700605z. Epub 2007 Nov 23. J Proteome Res. 2008. PMID: 18034456
-
The use of titanium dioxide micro-columns to selectively isolate phosphopeptides from proteolytic digests.Methods Mol Biol. 2009;527:57-66, xi. doi: 10.1007/978-1-60327-834-8_5. Methods Mol Biol. 2009. PMID: 19241005 Review.
-
Techniques for phosphopeptide enrichment prior to analysis by mass spectrometry.Mass Spectrom Rev. 2010 Jan-Feb;29(1):29-54. doi: 10.1002/mas.20219. Mass Spectrom Rev. 2010. PMID: 19263479 Review.
Cited by
-
Recent advances in enrichment and separation strategies for mass spectrometry-based phosphoproteomics.Electrophoresis. 2014 Dec;35(24):3418-29. doi: 10.1002/elps.201400017. Epub 2014 Jun 16. Electrophoresis. 2014. PMID: 24687451 Free PMC article. Review.
-
Recent Advances of Functional Proteomics in Gastrointestinal Cancers- a Path towards the Identification of Candidate Diagnostic, Prognostic, and Therapeutic Molecular Biomarkers.Int J Mol Sci. 2020 Nov 12;21(22):8532. doi: 10.3390/ijms21228532. Int J Mol Sci. 2020. PMID: 33198323 Free PMC article. Review.
-
Pepsin-Containing Membranes for Controlled Monoclonal Antibody Digestion Prior to Mass Spectrometry Analysis.Anal Chem. 2015 Nov 3;87(21):10942-9. doi: 10.1021/acs.analchem.5b02739. Epub 2015 Oct 22. Anal Chem. 2015. PMID: 26455365 Free PMC article.
-
In vitro aggregation assays using hyperphosphorylated tau protein.J Vis Exp. 2015 Jan 2;(95):e51537. doi: 10.3791/51537. J Vis Exp. 2015. PMID: 25590418 Free PMC article.
-
In situ digestion-assisted multi-template imprinted nanoparticles for efficient analysis of protein phosphorylation.Mikrochim Acta. 2023 Nov 30;190(12):490. doi: 10.1007/s00604-023-06081-7. Mikrochim Acta. 2023. PMID: 38030869
References
-
- Lee M, Goodbourn S. In: Regulation of Gene Expression. Chapman KE, Higgins SJ, editors. Portland Press; London, UK: 2001. pp. 71–86.
-
- Cohen P. Trends Biochem Sci. 2000;25:596–601. - PubMed
-
- Graves JD, Krebs EG. Pharmacol & Ther. 1999;82:111–121. - PubMed
-
- Hunter T. Cell. 2000;100:113–127. - PubMed
-
- Aebersold R, Mann M. Nature. 2003;422:198–207. - PubMed
Publication types
MeSH terms
Substances
Grants and funding
LinkOut - more resources
Full Text Sources
Other Literature Sources

