. 2013 Apr;9(4):e1003470.
doi: 10.1371/journal.pgen.1003470. Epub 2013 Apr 25.

Transposable elements are major contributors to the origin, diversification, and regulation of vertebrate long noncoding RNAs

Affiliations

Transposable elements are major contributors to the origin, diversification, and regulation of vertebrate long noncoding RNAs

Aurélie Kapusta et al. PLoS Genet. 2013 Apr.

Abstract

Advances in vertebrate genomics have uncovered thousands of loci encoding long noncoding RNAs (lncRNAs). While progress has been made in elucidating the regulatory functions of lncRNAs, little is known about their origins and evolution. Here we explore the contribution of transposable elements (TEs) to the makeup and regulation of lncRNAs in human, mouse, and zebrafish. Surprisingly, TEs occur in more than two thirds of mature lncRNA transcripts and account for a substantial portion of total lncRNA sequence (~30% in human), whereas they seldom occur in protein-coding transcripts. While TEs contribute less to lncRNA exons than expected, several TE families are strongly enriched in lncRNAs. There is also substantial interspecific variation in the coverage and types of TEs embedded in lncRNAs, partially reflecting differences in the TE landscapes of the genomes surveyed. In human, TE sequences in lncRNAs evolve under greater evolutionary constraint than their non-TE sequences, than their intronic TEs, or than random DNA. Consistent with functional constraint, we found that TEs contribute signals essential for the biogenesis of many lncRNAs, including ~30,000 unique sites for transcription initiation, splicing, or polyadenylation in human. In addition, we identified ~35,000 TEs marked as open chromatin located within 10 kb upstream of lncRNA genes. The density of these marks in one cell type correlate with elevated expression of the downstream lncRNA in the same cell type, suggesting that these TEs contribute to cis-regulation. These global trends are recapitulated in several lncRNAs with established functions. Finally a subset of TEs embedded in lncRNAs are subject to RNA editing and predicted to form secondary structures likely important for function. In conclusion, TEs are nearly ubiquitous in lncRNAs and have played an important role in the lineage-specific diversification of vertebrate lncRNA repertoires.


Conflict of interest statement

The authors have declared that no competing interests exist.

Figures
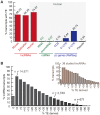
Figure 1
Figure 1. TE occurrence in lncRNAs.
See text, Methods and Table 1 for more details about lncRNA datasets. A. Percentage of transcripts with at least one exon overlapping with a TEs fragment (at least 10 bp). In red, lncRNAs (human = Gencode v13; mouse = both sets). Rest corresponds to human Refseq 57: in green, small non-coding RNAs (tRNAs and sno/miRNAs); in blue, protein-coding genes (pc genes) separated in exon types (coding and non-coding = UTRs); in black, pseudo = pseudogenes. B. Distribution of percentage of human lncRNA transcripts (Gencode v13) derived from TEs (more than 0% to more than 95%). The number of transcripts with more than 80% and more than 50% TE-derived DNA exons are indicated. Distribution is also shown for the subset of 36 studied lncRNAs presented in Table 2 and Table S2.
Figure 2
Figure 2. Coverage of different TE classes in genome, lncRNA, and protein-coding exons in human, mouse, and zebrafish.
For genomes, total length (100%) corresponds to total length of assembly without gaps (human: 2,897 Mb. Mouse: 2,620 Mb. Zebrafish: 1,401 Mb). For lncRNAs, total length of genomic projection of all of exons are considered (human, Genc. = Gencode v13: 14.2 Mb. Human, Cabili set: 8.5 Mb. Mouse, Ens70 = Ensembl 70: 2.8 Mb. Mouse, Kutter: 0.15 Mb. Zebrafish: 2.3 Mb). For protein coding genes (pc genes), total length of CDS exons, 5′ and 3′UTR respectively are as follow: human, 30.9 Mb, 5.2 Mb, 24.6 Mb. Mouse: 30.5 Mb, 4.0 Mb, 21.6 Mb. Zebrafish: 19.1 Mb, 33.6 Mb, 12.5 Mb. Only pc genes from Refseq annotations with CDS and UTR features are considered (see Methods). Percentage of coverage of all TEs is indicated above bars.
Figure 3
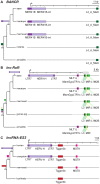
Figure 3. Examples of lncRNAs with embedded TEs.
Genomic DNA is represented as a grey line, transcripts are represented by a black line, with arrows showing sense of transcription and in grey boxes the exons of the mature transcript. TEs as colored boxes (orange-red: DNA TEs. Yellow: SINEs. Pink-purple: LTR/ERVs. Green: LINEs). Only TEs overlapping with lncRNA exons are represented. See also Table S2 for details of TEs in these lncRNAs. A. BANCR . B. lnc-RoR . Apes = gibbon, gorilla, orangutan, bonobo, chimpanzee, human. C. lnc-ES3 .
Figure 4
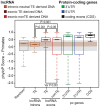
Figure 4. Evidence of purifying selection in TE–derived DNA transcribed as lncRNAs.
LncRNAs correspond to Gencode v13 (human) and protein coding genes to Refseq 57 (human, 20,848 genes). Boxplots show primate PhyloP scores computed in order to compare the conservation of different sets (see upper panel). Random set is size and number-matched for TE-derived DNA in lncRNA exons. Intronic lncRNA TEs correspond to TE-derived DNA in lncRNA introns that don't overlapp with splicing sites and all annotated chromatin marks were removed (see Methods), in order to obtain a most neutral set [inactive chromatin, see 32]. Statistical test used: permutation test with 1000 permutations were performed in R. Boxplots depicts the median upper (75%) and lower (25%) quantiles. The whiskers extend beyond the upper and lower quantile by 1.5× the inner quartile range. Outliers have been removed for visualization.
Figure 5
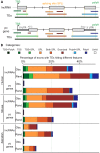
Figure 5. Contribution of TEs to different gene features of lncRNAs.
A. Schematic of the type of overlap between TE and lncRNA sequences. Upper panel shows an idealized lncRNA transcription unit, and lower panel shows a protein-coding gene (only genes with annotated 5′ and 3′UTRs were analyzed; see Methods). Exons (grey boxes) overlapping a TE are categorized based on the type of overlap: the TE may provide functional feature(s), as a transcription start site (TSS), the first exon (including TSS and splicing site: TSS+SPL), a splicing site (SPL), a middle exon (including the 2 splicing sites (Both SPL), a polyadenylation site (polyA), the last exon (including splicing site and PolyA: PolyA+SPL). A TE not overlapping with any feature is called exonized. B. Comparison between observed (Obs) and random (Rand) distribution (see Methods). Note that a given exon can belong to several categories since a given TE can hit different exons and therefore be counted multiple times. Unhit exons correspond to exons with no TE overlap. Human: lncRNAs from Gencode v13. Mouse: lincRNAs from Ensembl release 70. With the exception of ‘exonized’, ‘TSS’ and ‘polyA’ categories in mouse (p-values = 1, 0.001 and 0.298 respectively) and ‘exonized’ category in zebrafish (p-value = 0.001), the p-values were systematically <0.0001.
Figure 6
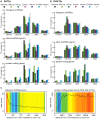
Figure 6. TE amounts and types in human lncRNA and their surrounding regions.
Regions are genome, intergenic regions and exons. In the case of protein coding genes, exons include UTR exons as well as coding exons. 1 or 10 kb up and dw = intergenic regions up to 1 or 10 kb upstream of the TSS and downstream of the polyA respectively. Any annotated exons (RefSeq and Gencode v13 lncRNAs) have been subtracted from intergenic and intronic regions. A. Coverage of all TEs. LncRNA set corresponds to Gencode v13, separated in lincRNA transcripts (intergenic) and genic transcripts. Coverage is calculated as described for Figure 2 and in Methods and is shown per TE class (LTR/ERV, nonLTR/LINE, nonLTR/SINE, DNA) with an additional separation between ERVs (LTR/LTR) and internal parts (LTR/int) of ERV elements. B. Same as A, except that only TEs that overlap with DNaseI hypersensitive sites (‘TE-DHS’) are considered (see Methods). C. Heatmap of distance between LTR and lincRNA (left) and protein-coding genes (right) aggregated for all chromosomes (Jaccard test see Methods). The x-axis is the alignment of all reference features (protein coding exons and lncRNAs). The line depicts the total percentage of TEs found along the reference feature. The color quantifies the departure from null distribution generated from permutation. “Hot” (red) and “cool” (blue) colors mean that there was more or less TEs observed at a given position than by chance, respectively. All p–value <0.001.
Figure 7
Figure 7. Wordle representation of the most enriched TE families in lncRNAs.
Colors refer to different TE classes: purple = LTR, green = LINE, yellow = SINE, red = DNA. A. See also Figure S4. Human lncRNA set is from Gencode v13, mouse is from Esembl. The expected and observed counts of fragments corresponding to each TE are calculated using RepeatMasker output (see Methods). Observed values are obtained by considering overlapping TEs lncRNA exons. Expected values are calculated based on the overall density of each TE family in the genome according to the RepeatMasker output assuming a random distribution of TE family members throughout the genome.). Only families statistically enriched in term of counts (fragment numbers) are kept (at least p-value<0.05, binomial distribution test) and only ratios above 2 are represented on wordle. For human sets, TEs with less than 5 fragments in lncRNAs are removed, 4 fragments for mouse and zebrafish. Size of the TE family name is proportional to its over-representation (scales of 5× or 10× are represented). B. Visual representation of the 25 most abundant TE families in the 3 species. Size of the TE family name is proportional to its percentage of TE derived DNA in the genome (scale of 2% is represented).
Figure 8
Figure 8. lncRNAs with cell-type specific expression are also associated with cell-type specific TE–DHS.
Cell-type specific lncRNA based on RNA-Seq expression (cutoff of 10-fold higher) were identified in GM = GM12878, H1 or K562. Numbers of cell-type specific lncRNAs are written above graphs. For each lncRNA, only the most active proximal TE-DHS (<10 Kb) was retained and the distribution of normalized tag counts over these elements are shown in each cell type (*** for P<0.0001, ns for P>0.5.).
Figure 9
Figure 9. Lineage-specific TE insertions in cyrano.
Symbols and graphics are as in Figure 3. The structure of cyrano (lnc-oip5) is based on coordinates of Gencode v13 transcript OIP5-AS1-001. Vertebrate PhastCons: peaks of sequence conservation across 46 vertebrate genomes displayed in the UCSC genome browser.
Figure 10
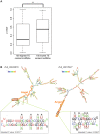
Figure 10. TE contribution to predicted lncRNA secondary structures.
A. High and low TE content groups of 100 lncRNA were extracted from Gencode v13 set (TE content from 96.74% to 100% and from 0.49% to 2.27% respectively; see Table S7). P-values were calculated by Randfold and provide an indication of predicted secondary structure stability. The boxplot depicts the maximum, upper quantile, median, lower quantile and minimum value in a standard way. The mean of these 2 groups are significantly different by Wilcox rank sum test (p = 0.0022). B. Predicted secondary structures (RNAfold [115]) and compensatory mutations for two zebrafish lncRNAs containing ANGEL (DNA TEs) elements. In structures, TE derived regions are marked by solid line and base pairing probability by color spectrum (from 0 in violet to 1 in red). Zoom-in windows show part of stem with compensatory mutations: nucleotide substitution are boxed and the corresponding nucleotide found in ANGEL consensus are shown under/above actual RNA sequence. Sites of compensatory mutations are marked by asterisks and written p-values are adjusted by Bonferroni methods.
Figure 11
Figure 11. Long stem in two human lincRNAs (Cabili set) formed by inverted TEs.
Two examples of heavily edited human lincRNA transcripts with editing sites located in TEs. RNA structures are predicted by RNAfold . Nucleotide color in structures indicates base pairing probability (from 0 to 1). Inverted TE pairs are marked by solid lines, the arrow illustrating TE strand. The stem pair of TCONS_00017795 is composed by inverted Alu elements, while the structure of TCONS_0001109 is formed by 2 LTRs (MLT2B3).

Similar articles

Cited by

References

    1. Pheasant M, Mattick JS (2007) Raising the estimate of functional human sequences. Genome Res 17: 1245–1253. - PubMed
    1. Ponting CP, Hardison RC (2011) What fraction of the human genome is functional? Genome Res 21: 1769–1776. - PMC - PubMed
    1. Gerstein MB, Kundaje A, Hariharan M, Landt SG, Yan KK, et al. (2012) Architecture of the human regulatory network derived from ENCODE data. Nature 489: 91–100. - PMC - PubMed
    1. Dinger ME, Amaral PP, Mercer TR, Mattick JS (2009) Pervasive transcription of the eukaryotic genome: functional indices and conceptual implications. Brief Funct Genomic Proteomic 8: 407–423. - PubMed
    1. Mercer TR, Dinger ME, Mattick JS (2009) Long non-coding RNAs: insights into functions. Nat Rev Genet 10: 155–159. - PubMed

Publication types

Substances