. 2013 May 1;33(18):7928-40.
doi: 10.1523/JNEUROSCI.1571-12.2013.

Increased cell-intrinsic excitability induces synaptic changes in new neurons in the adult dentate gyrus that require Npas4

Affiliations

Increased cell-intrinsic excitability induces synaptic changes in new neurons in the adult dentate gyrus that require Npas4

Shuyin Sim et al. J Neurosci. .

Erratum in

  • J Neurosci. 2013 Jun 19;33(25):10582. Lin, Ying-Xi [corrected to Lin, Yingxi]

Abstract

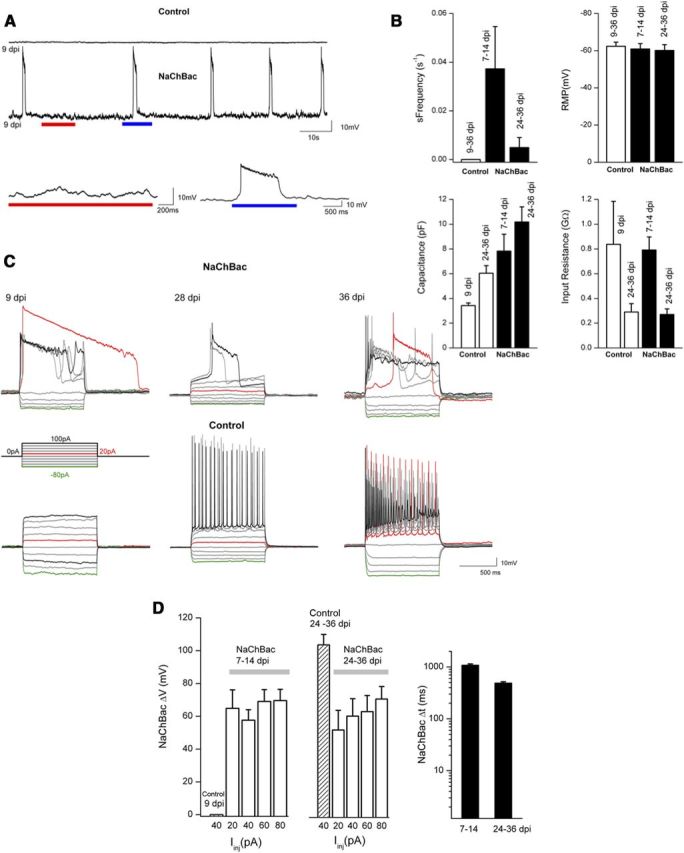
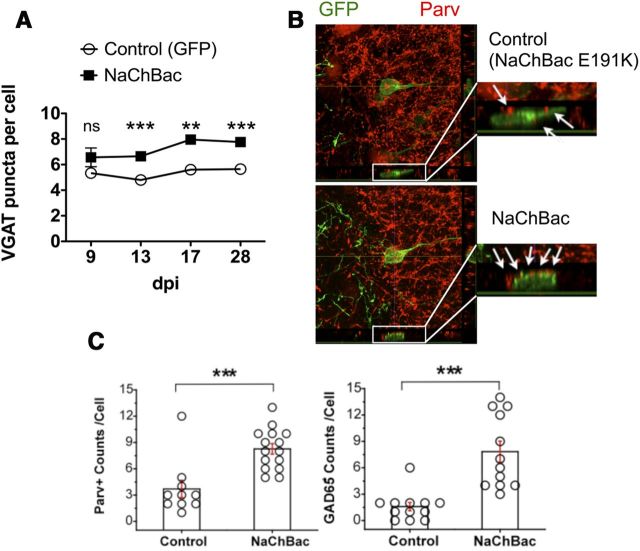
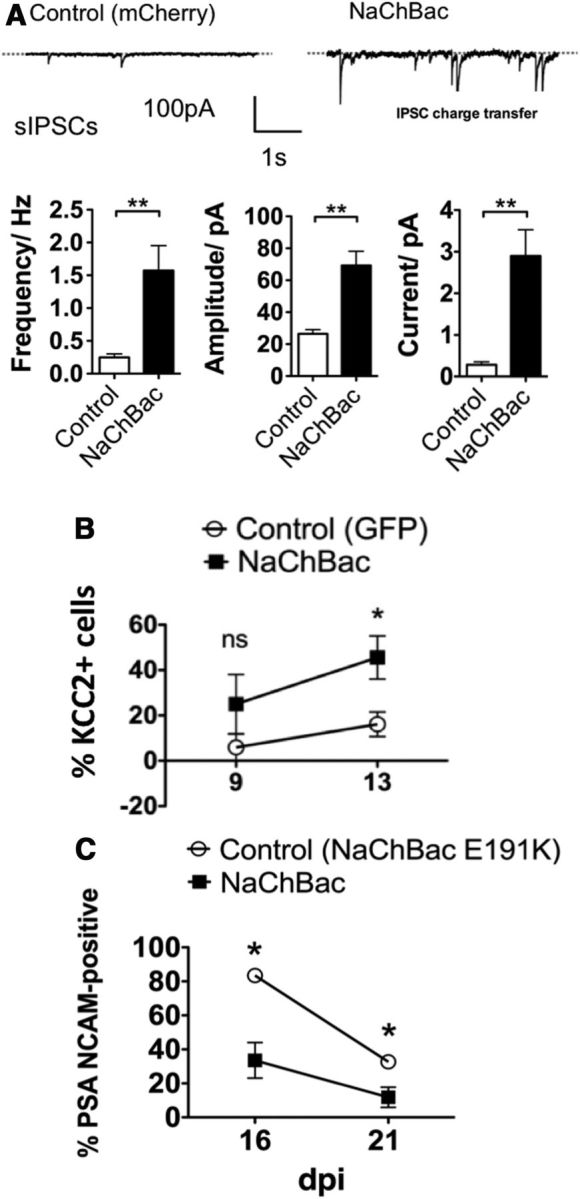
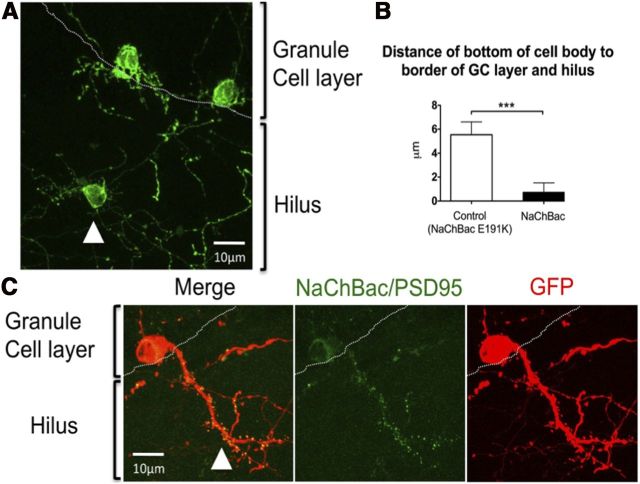
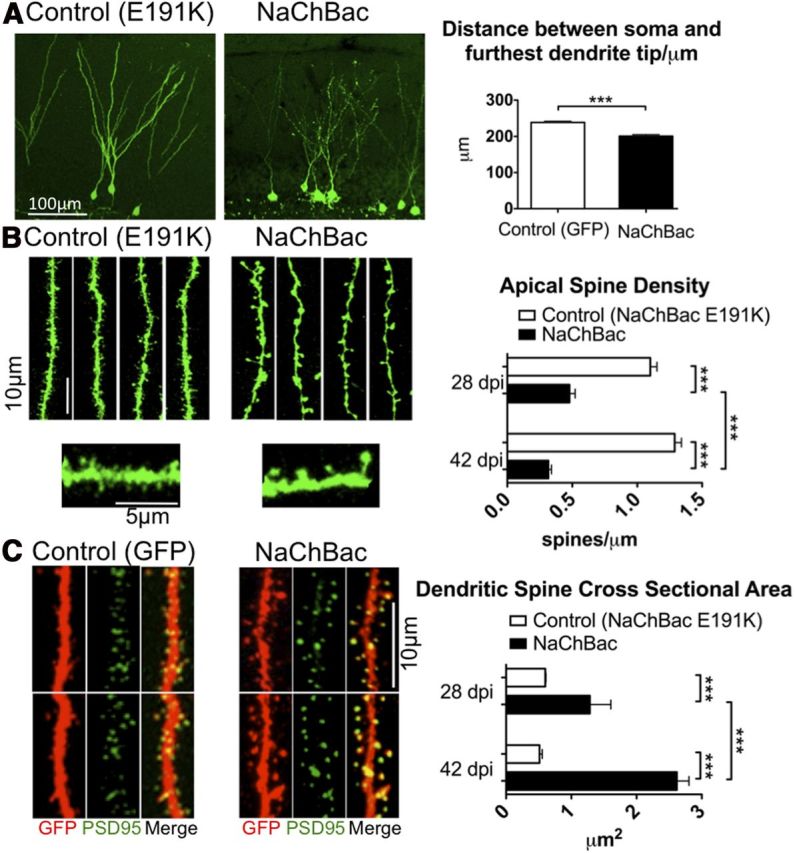
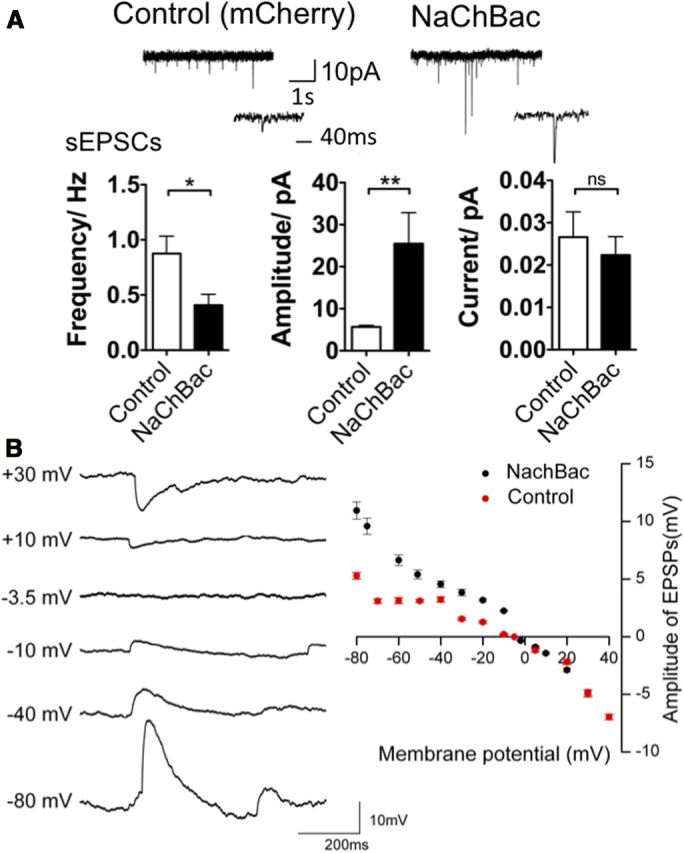
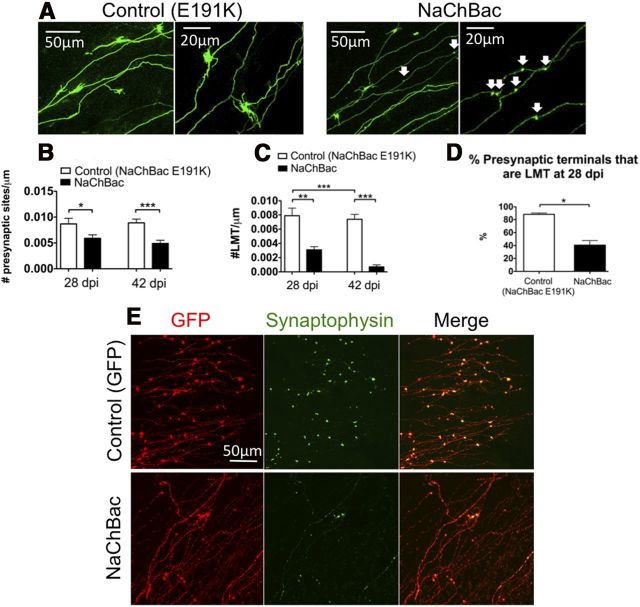
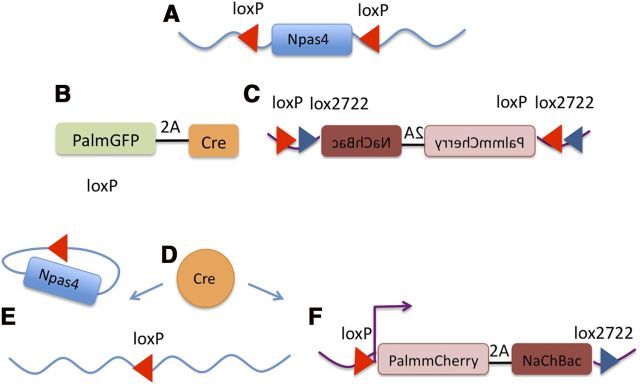
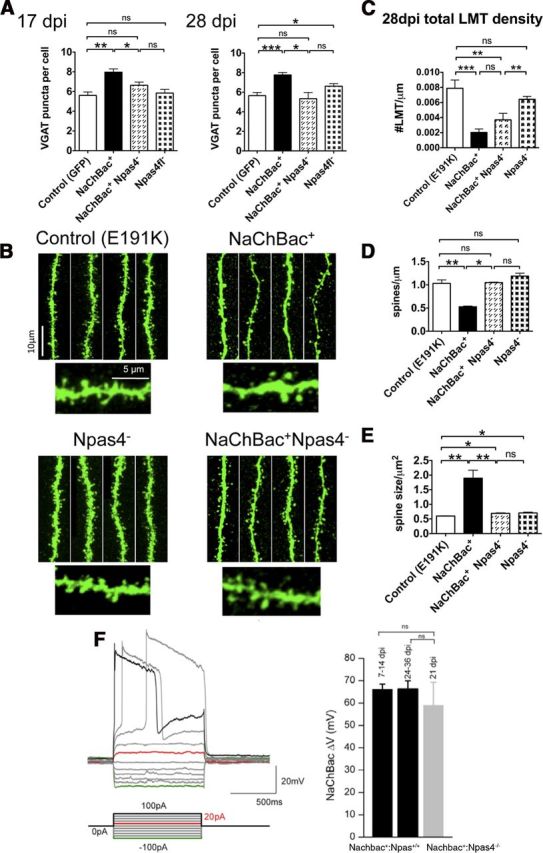
Electrical activity regulates the manner in which neurons mature and form connections to each other. However, it remains unclear whether increased single-cell activity is sufficient to alter the development of synaptic connectivity of that neuron or whether a global increase in circuit activity is necessary. To address this question, we genetically increased neuronal excitability of in vivo individual adult-born neurons in the mouse dentate gyrus via expression of a voltage-gated bacterial sodium channel. We observed that increasing the excitability of new neurons in an otherwise unperturbed circuit leads to changes in both their input and axonal synapses. Furthermore, the activity-dependent transcription factor Npas4 is necessary for the changes in the input synapses of these neurons, but it is not involved in changes to their axonal synapses. Our results reveal that an increase in cell-intrinsic activity during maturation is sufficient to alter the synaptic connectivity of a neuron with the hippocampal circuit and that Npas4 is required for activity-dependent changes in input synapses.


Figures

Figure 1.
Figure 1.
Expression of NaChBac increases spontaneous neuronal activity in adult-born DG GCs. A, Top traces, In current-clamp mode, 9 dpi wild-type (mCherry+) DG neurons did not fire spontaneous action potentials. In contrast, NaChBac expression resulted in spontaneous depolarizations of 9 dpi DG neurons (middle trace). The NaChBac depolarization marked by the red bar is shown magnified at the bottom right of the panel. In addition, NaChBac expression also resulted in oscillations of the resting membrane potential (indicated by blue bar and shown magnified at the bottom left), which were not present in control cells. B, Top left, Control, mCherry+ neurons did not show any spontaneous firing at any time tested (between 9 and 36 dpi). In contrast, NaChBac expression in DGs induced spontaneous depolarizations at all times tested (0.037 ± 0.017 Hz at 7–14 dpi and 0.005 ± 0.004 Hz at 24–36 dpi; both n = 10). Top right, NaChBac expression did not affect the resting membrane potentials [−62.4 ± 2.2mV for wild-type (mCherry+) neurons, −60.9 ± 2.9 and −60.1 ± 3.1 mV for 7–14 and 24–36 dpi NaChBac-expressing neurons; each condition, n = 10]. Bottom left, NaChBac expression increases the capacitance of DG neurons. The capacitance increased from 3.42 ± 0.21 pF in wild-type (mCherry+) 9 dpi neurons (n = 4) to 7.8 ± 1.3 pF in NaChBac+ 7–14 dpi cells and from 6.03 ± 0.61 pF in wild-type cells to 10.2 ± 1.2 pF in NaChBac+ cells in between 24 and 36 dpi (n = 12 and n = 10, respectively). Bottom right, NaChBac expression did not affect the input resistance of DG neurons. Between 7 and 14 dpi, input resistance was 837 ± 345 and 792 ± 105 MΩ for wild-type and NaChBac+ neurons, respectively. Input resistance was also comparable between 24 and 36 dpi, 291 ± 67 MΩ for wild-type, and 271 ± 45 MΩ for NaChBac+ neurons. C, Left traces, Current injection in NaChBac+ cells (top) induced long-lasting depolarizations in 9 dpi DG neurons. In contrast, mCherry+ 9 dpi neurons (bottom) only showed passive membrane responses to the same amount of injected current. Middle and right traces, Current injection induced long depolarizations in 28 and 36 dpi NaChBac+ neurons and trains of repetitive action potentials in control, mCherry+ neurons. D, Left, Steps of current injection, up to 100 pA, were not able to elicit sodium action potentials in 9 dpi control cells (n = 4). In contrast, current injection as low as 20 pA triggered sustained depolarizations in NaChBac+ cells, whose amplitude did not significantly increase on higher levels of current injection (65.5 ± 3.1mV; n = 10). From 24 to 36 dpi, in wild-type, mCherry+ neurons, sodium spikes can be triggered by an average current of 40 ± 7.3 pA, ∼20 pA above the threshold necessary to elicit an NaChBac depolarization (n = 6). During this period, the NaChBac peak amplitude gradually increased from 54.5 ± 12.2 to 73.7 ± 7.8 mV during 20–80 pA current injections (n = 10). Right, The duration of the NaChBac response was assessed in 10–90% for the rise and decay time of the depolarization. This typically fell within the range 1076 ± 69 ms for 7–14 dpi and 485 ± 33 ms for 24–36 dpi.
Figure 2.
Figure 2.
Expression of NaChBac in adult-born DG GCs results in additional perisomatic GABAergic inputs. A, NaChBac+ neurons displayed increased numbers of perisomatic VGAT+ inhibitory terminals from 13 dpi onward (9 dpi GFP, 5.341 ± 0.269 VGAT+ puncta/soma, n = 94 neurons from 5 DGs; NaChBac, 6.57 ± 0.733 VGAT+ puncta/soma, n = 72 neurons from 5 DGs, p = 0.176; 13 dpi GFP, 4.794 ± 0.322 VGAT+ puncta/soma, n = 100 neurons from 8 DGs; NaChBac, 6.648 ± 0.217 VGAT+ puncta/soma, n = 109 neurons from 8 DGs, ***p = 0.0005; 17 dpi GFP, 5.6098 ± 0.342 VGAT+ puncta/soma, n = 56 neurons from 4 DGs; NaChBac, 7.96 ± 0.339 VGAT+ puncta/soma, n = 115 neurons from 4 DGs, **p = 0.0045; 28 dpi GFP, 5.65 ± 0.325 VGAT+ puncta/soma, n = 121 neurons from 6 DGs; NaChBac, 7.76 ± 0.258 VGAT+ puncta/soma, n = 115 neurons from 6 DGs, ***p = 0.0005). B, Confocal z-stack images of parvalbumin (Parv) staining of control and NaChBac+ neurons. C, Consistent with the increase in VGAT+ perisomatic contacts (B), NaChBac+ GCs have more parvalbumin- and GAD65-positive contacts on their cell bodies than control cells expressing the E191K pore-dead mutant channel. Two-tailed t test used for statistical analysis. Error bars represent SEM.
Figure 3.
Figure 3.
Cell-intrinsic hyperexcitability induces increased synaptic inhibition and accelerates neuronal maturation. A, In voltage-clamp mode, control neurons (top panel, left trace) experienced few spontaneous inhibitory synaptic events, whereas NaChBac+ neurons (top panel, right trace) had frequent spikes of inhibitory inputs that were of higher amplitudes. Both frequency (bottom panel, left) and amplitude (bottom panel, middle) of spontaneous IPSCs received by NaChBac+ neurons are higher than those received by control neurons (mCherry control frequency, 0.248 ± 0.054 Hz, n = 7 neurons; NaChBac frequency, 1.571 ± 0.381 Hz, n = 9 neurons, **p = 0.009; mCherry control amplitude, 26.42 ± 2.68 pA, n = 7 neurons; NaChBac amplitude, 69.28 ± 8.9 pA, n = 9 neurons, **p = 0.001). Overall current received by NaChBac+ neurons is ∼10 times that received by control neurons (mCherry control, 0.281 ± 0.071 pA, n = 7 neurons; NaChBac, 2.9 ± 0.63, n = 8 neurons; bottom panel, right). B, A larger proportion of neurons expressing NaChBac are KCC2 positive compared with E191K control neurons at 13 dpi, suggesting that NaChBac accelerates the upregulation of KCC2 in GCs. *p = 0.023. C, Significantly fewer NaChBac+ neurons expressed PSA-NCAM at both 16 and 21 dpi compared with controls (16 dpi E191K control, 83.5 ± 1.35%, n = 2 DGs; NaChBac, 33.57 ± 10.5%, n = 3 DGs, *p = 0.0347; 28 dpi E191K control, 32.67 ± 3.6%, n = 3 DGs; NaChBac, 11.81 ± 5.9%, n = 3 DGs, *p < 0.05). Two-tailed t test used for statistical analysis. Error bars represent SEM.
Figure 4.
Figure 4.
Increased electrical activity via NaChBac results in ectopic localization of DG GCs, reduced migration, and persistence of basal dendrites. A, NaChBac+ GCs were occasionally found in the hilar region of the DG (arrowhead) in which control neurons are never found. Stippled line represents the boundary between the GC layer and hilus. B, NaChBac+ GCs have cell bodies that are located lower within the GC layer of the DG compared with control neurons expressing the pore-dead NaChBac E191K. ***p = 0.0004. Two-tailed t test used for statistical analysis. Error bars represent SEM. C, Basal dendrites on NaChBac+ GCs displayed PSD-95:GFP+ clusters. Image on the right (labeled GFP) shows immunocytochemistry against the diffuse, unclustered GFP that filled the cytoplasm with a red secondary antibody. Middle image (labeled NaChBac/PSD95) shows the PSD-95:GFP-positive clusters identified by the direct green fluorescence from GFP. Stippled line represents the boundary between the GC layer and hilus.
Figure 5.
Figure 5.
Elevated neuronal excitability in DG granule neurons leads to morphological changes in excitatory glutamatergic inputs. A, Low-magnification confocal images showing decreased dendritic length of NaChBac+ neurons compared with control neurons (pore-dead NaChBac E191K) (left panels). The distance between the furthest dendrite tip to the base of the apical dendrite is significantly lower in NaChBac+ neurons than controls at 28 dpi (far right panel; GFP control, 238.6 ± 3.23 μm, n = 71 neurons; NaChBac, 200.8 ± 4.35 μm, n = 56 neurons, ***p < 0.0001). B, High-magnification confocal images showing the decreased spine density and increased spine size in NaChBac+ neurons (left panels). NaChBac+ neurons have significantly fewer spines per length of dendrite than control (NaChBac E191K) neurons (far right panel; 28 dpi E191K control, 1.1 ± 0.05 spines/μm n = 21 images; NaChBac, 0.478 ± 0.044 spines/μm, n = 40 images, ***p < 0.0001; 42 dpi E191K control, 1.29 ± 0.052 spines/μm, n = 17 images; NaChBac, 0.316 ± 0.024 spines/μm, n = 9 images, ***p < 0.0001; 28 vs 42 dpi E191K, *p = 0.014). C, All dendritic protrusions on both control and NaChBac+ neurons cluster PSD-95:GFP, suggesting that they represent functional excitatory input synapses. Larger spines also exhibit correspondingly larger PDS95:GFP+ puncta (left panels). NaChBac+ neurons have significantly larger spines than control neurons at both 28 and 42 dpi (far right panel; 28 dpi E191K control, 0.636 ± 0.073 μm2, n = 52 images from 4 DGs; NaChBac, 1.298 ± 0.15 μm2, n = 24 images from 4 DGs, ***p < 0.0001; 42 dpi E191K control, 0.513 ± 0.042 μm2, n = 75 images from 5 DGs; NaChBac, 2.618 ± 0.18 μm2, n = 35 images from 8 DGs, ***p < 0.0001; 28 vs 42 dpi NaChBac, ***p < 0.0001).
Figure 6.
Figure 6.
Elevated neuronal excitability in DG granule neurons leads to electrophysiological changes in excitatory glutamatergic inputs. A, sEPSCs were recorded in control (mCherry+) neurons and NaChBac+ neurons at 28 dpi (top panel). At 28 dpi, the frequency of sEPSCs was significantly lower for NaChBac+ neurons than control (mCherry control, 0.876 ± 0.158 Hz, n = 6 neurons; NaChBac, 0.408 ± 0.098, n = 5 neurons, *p = 0.041; right panel, leftmost), whereas the average amplitude was higher (mCherry control, 5.653 ± 0.387 pA, n = 6 neurons; NaChBac, 25.46 ± 7.4 pA, n = 5 neurons, **p = 0.016; right panel, middle). The overall excitatory current received by NaChBac was not significantly different from controls (mCherry control, 0.0266 ± 0.0059 pA, n = 6 neurons; NaChBac, 0.0224 ± 0.0043, n = 4 neurons, p = 0.62; right panel, rightmost). B, sEPSPs for NaChBac+ and mCherry+ neurons reverse polarity at the same membrane potential (24–36 dpi). Left, sEPSPs recorded at six different membrane potentials in the same NaChBac+ neuron. Recordings were made in the presence of 10 μm bicuculline and 3 μm TTX and with a CsCl-filled electrode. Right, The amplitude of sEPSPs for NaChBac+ and control mCherry+ neurons recorded in the same slice are plotted against the membrane potential. The reversal potential was −4.25 ± 0.18 and −4.4 ± 0.06 mV for NaChBac+ and mCherry+ neurons, respectively (n = 2). Two-tailed t test used for statistical analysis. Error bars represent SEM.
Figure 7.
Figure 7.
Elevated neuronal excitability in DG granule neurons leads to changes in excitatory output targets at CA3. A, Confocal maximal projection images showing LMTs and en passant boutons (white arrows) on the axons of NaChBac+ and control neurons. B, Axons of NaChBac+ neurons showed an overall decrease in the total number of presynaptic sites compared to controls at both 28 and 42 dpi (28 dpi E191K control: 0.0087 ± 0.0011 sites/m, n = 11 images; NaChBac: 0.0059 ± 0.00068 sites/m, n = 11 images, *p < 0.05; 42 dpi E191K control: 0.01 ± 0.00075 sites/m, n = 10 images; NaChBac: 0.0056 ± 0.00059 sites/m, n = 12 images, ***p = 0.0001). C, NaChBac+ neurons had significantly fewer LMTs on their axons compared to controls at both 28 and 42 dpi (28 dpi E191K control: 0.0079 ± 0.0011 LMT/m, n = 11 images; NaChBac: 0.0031 ± 0.00043 LMT/m, n = 11 images, **p = 0.0013; 42 dpi E191K control: 0.0074 ± 0.00068 LMT/m, n = 10 images; NaChBac: 0.0007 ± 0.00029 LMT/m, n = 12 images, ***p < 0.0001; 28 vs 42 dpi NaChBac ***p = 0.0001). D, The percentage of presynaptic sites that were LMTs at 28 dpi was much lower in NaChBac+ neurons than neurons expressing the pore-dead channel (E191K control: 88.24 ± 1.95%, n = 17 images; NaChBac: 40.66 ± 7.05%, n = 19 images, *p < 0.03). E, Structures resembling presynaptic terminals on the axons of both control and NaChBac+ neurons accumulated synaptophysin:GFP, suggesting the change in density of the different structures correlates with a change in presynaptic sites. Two-tailed t test used for statistical analysis. Error bars represent SEM.
Figure 8.
Figure 8.
Strategy to selectively delete Npas4 in hyperexcitable DG neurons. Npas4 conditional mice (A) are simultaneously infected with two independent viruses (B, C). The B virus carries a bicistronic cassette encoding both a membrane-bound form of GFP (PalmGFP) and the recombinase Cre. The C virus carries (in a reversed 3′ to 5′ orientation) a bicistronic cassette encoding both a membrane-bound form of the red fluorescent protein mCherry and NaChBac (Palmmcherry2ANaChBac). The Palmmcherry2ANaChBac cassette (arranged in the reverse 3′ to 5′ orientation with respect to the viral promoter) is flanked by a set of mutually incompatible double loxp sites (loxP and lox2722). Cells infected only with virus C are not detectable because they do not express either Palmmcherry or NaChBac. Cells from the conditional Npas4 mouse infected only by the virus B express PalmG and the protein Cre (D), which induces the deletion of the NPAS4 gene flanked by loxp sites (E). In cells infected by both viruses B and C, the cre protein (D) from the B virus leads to the simultaneous deletion of NPAS4 (E) and to the reversion of orientation of the Palmmcherry2ANaChBac cassette from the C virus (F). Thus, only cells doubly infected by viruses B and C display both green and red fluorescence (because they express both PalmGFP and PalmMCherry), and they are hyperexcitable because of NaChBac expression and become deficient in NPAS4 as a result of Cre expression.
Figure 9.
Figure 9.
Excitability-induced changes in input connectivity are dependent on cell-autonomous Npas4 signaling. A, Deletion of Npas4 blocked the increase in VGAT+ perisomatic contacts observed in NaChBac+ neurons at both 17 and 28 dpi (17 dpi: GFP control, 5.61 ± 0.34 VGAT+ puncta/soma, n = 56 neurons from 4 DGs; NaChBac+, 7.96 ± 0.34 VGAT+ puncta/soma, n = 115 neurons from 4 DGs; NaChBac+Npas4, 6.64 ± 0.32 VGAT+ puncta/soma, n = 84 neurons from 5 DGs; GFP control vs NaChBac+, **p < 0.005; NaChBac+ vs NaChBac+Npas4, *p = 0.03; 28 dpi: GFP control, 5.65 ± 0.33 VGAT+ puncta/soma, n = 121 neurons from 6 DGs; NaChBac+, 7.8 ± 0.26 VGAT+ puncta/soma, n = 115 neurons from 6 DGs; NaChBac+Npas4, 5.33 ± 0.64 VGAT+ puncta/soma, n = 70 neurons from 5 DGs; GFP control vs NaChBac+, ***p = 0.0005; NaChBac+ vs NaChBac+Npas4, *p = 0.017). Absence of Npas4 alone did not decrease the number of contacts and caused a slight increase at 28 dpi (17 dpi: Npas4, 5.84 ± 0.37 VGAT+ puncta/soma, n = 85 neurons from 4 DGs; E191K control vs Npas4, p = 0.67; 28 dpi: Npas4, 6.61 ± 0.26 VGAT+ puncta/soma, n = 130 neurons from 5 DGs; E191K control vs Npas4, *p < 0.05). B, High-magnification confocal maximal projection images showing that eliminating Npas4 signaling from NaChBac+ neurons effectively restored spine density and size to resemble that of controls. C, Deletion of Npas4 from NaChBac+ neurons had no change on the decrease in LMT density observed (NaChBac+, 0.002 ± 0.00046 LMT/μm, n = 11 images; NaChBac+Npas4, 0.0037 ± 0.00086 LMT/μm, n = 18 images, p = 0.1; E191K control vs NaChBac+, ***p = 0.0003; E191K control vs NaChBac+Npas4, **p = 0.006; NaChBac+Npas4 vs Npas4, **p = 0.008). D, Absence of Npas4 signaling prevented decrease in spine density resulting from NaChBac activity; there was no significant difference between the spine density on control neurons and that of NaChBac+ neurons lacking Npas4 (E191K control, 1.05 ± 0.001 spines/μm, n = 21 images from 4 DGs; NaChBac+Npas4, 1.03 ± 0.075 spines/μm, n = 47 images from 4 DGs, p = 0.83; E191K control vs NaChBac+, **p = 0.007; NaChBac+ vs NaChBac+Npas4, *p = 0.0235). Deletion of Npas4 alone did not increase spine density (Npas4, 1.19 ± 0.063 spines/μm, n = 51 images from 5 DGs; E191K control vs Npas4, p = 0.158). E, Deletion of Npas4 from NaChBac+ neurons decreased dendritic spine size to almost as low as control levels (E191K control, 0.6 ± 0.009 μm2, n = 24 images from 3 DGs; NaChBac+Npas4, 0.69 ± 0.018 μm2, n = 37 images from 4 DGs, *p = 0.01). Deletion of Npas4 alone did not decrease spine size but led to a very small increase (Npas4, 0.71 ± 0.027 μm2, n = 50 images from 5 DGs; E191K control vs Npas4, *p = 0.02; NaChBac+Npas4 vs Npas4, p = 0.69). Two-tailed t test used for statistical analysis. Error bars represent SEM. F, The electrical signatures of NaChBac action were similar regardless of the status of NPAS4. Left, Current injection steps in NaChBac+:Npas4−/− neurons triggered long-lasting depolarizations in a similar mode as they did in NaChBac+:Npas4+/+ cells (compare with traces in Fig. 1C). Right, There was no significant difference between the average amplitude of NaChBac depolarizations in Npas4+/+ and NPAS4−/− neurons: 66.3 ± 3.6 mV for 7–14 dpi, NaChBac+:Npas4+/+; 66.12 ± 2.3 mV for 24–36 dpi, NaChBac+:Npas4+/+; and 58.9 ± 10.36 mV for 21 dpi, NaChBac+:Npas4+/+.

Similar articles

Cited by

References

    1. Abusaad I, MacKay D, Zhao J, Stanford P, Collier DA, Everall IP. Stereological estimation of the total number of neurons in the murine hippocampus using the optical disector. J Comp Neurol. 1999;408:560–566. doi: 10.1002/(SICI)1096-9861(19990614)408:4<560::AID-CNE9>3.0.CO%3B2-P. - DOI - PubMed
    1. Acsády L, Kamondi A, Sík A, Freund T, Buzsáki G. GABAergic cells are the major postsynaptic targets of mossy fibers in the rat hippocampus. J Neurosci. 1998;18:3386–3403. - PMC - PubMed
    1. Bean BP. The action potential in mammalian central neurons. Nat Rev Neurosci. 2007;8:451–465. doi: 10.1038/nrn2148. - DOI - PubMed
    1. Bi GQ, Poo MM. Synaptic modifications in cultured hippocampal neurons: dependence on spike timing, synaptic strength, and postsynaptic cell type. J Neurosci. 1998;18:10464–10472. - PMC - PubMed
    1. Chaudhry FA, Reimer RJ, Bellocchio EE, Danbolt NC, Osen KK, Edwards RH, Storm-Mathisen J. The vesicular GABA transporter, VGAT, localizes to synaptic vesicles in sets of glycinergic as well as GABAergic neurons. J Neurosci. 1998;18:9733–9750. - PMC - PubMed

Publication types

MeSH terms

Substances

LinkOut - more resources